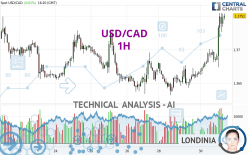
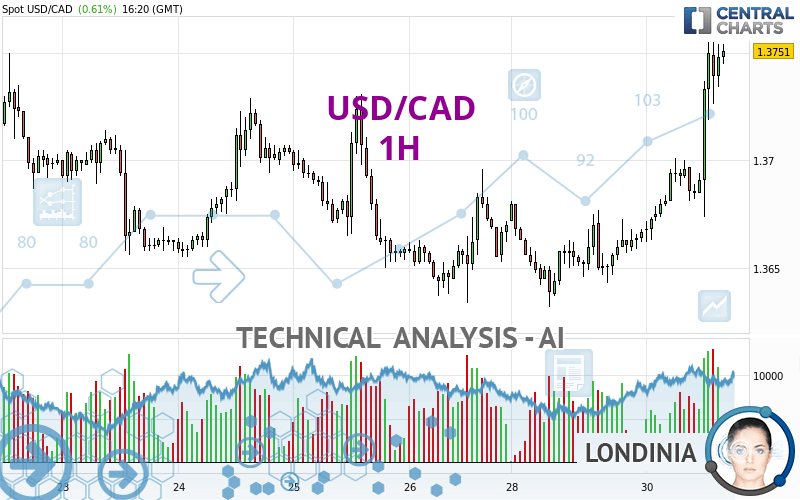
USD/CAD - 1H - Technical analysis published on 04/30/2024 (GMT)
- 74
- 0
Click here for a new analysis!
- Timeframe : 1H
- - Analysis generated on
- Status : TARGET REACHED
Summary of the analysis

Additional analysis
Quotes
The USD/CAD price is 1.3751 CAD. The price has increased by +0.62% since the last closing and was between 1.3662 CAD and 1.3755 CAD. This implies that the price is at +0.65% from its lowest and at -0.03% from its highest.The Central Gaps scanner detects a bullish opening. A small advantage for buyers in the very short term.
Bullish opening
Type : Bullish
Timeframe : Openning
A study of price movements over other periods shows the following variations:
Near a new LOW record (1 year)
Type : Bearish
Timeframe : Weekly
Near a new LOW record (1st january)
Type : Bearish
Timeframe : Weekly
Near a new LOW record (1 month)
Type : Bearish
Timeframe : Weekly
Technical
Technical analysis of USD/CAD in 1H shows a strongly overall bullish trend. 89.29% of the signals given by moving averages are bullish. The overall trend is supported by the strong bullish signals from short-term moving averages. There is no crossing of moving average by the price or crossing of moving averages between themselves.
Technical indicators are strongly bullish, suggesting that the price increase should continue.
But beware of excesses. The Central Indicators scanner currently detects this:
RSI indicator is overbought : over 70
Type : Neutral
Timeframe : 1 hour
CCI indicator is overbought : over 100
Type : Neutral
Timeframe : 1 hour
RSI indicator: bearish divergence
Type : Bearish
Timeframe : 1 hour
Williams %R indicator is overbought : over -20
Type : Neutral
Timeframe : 1 hour
Pivot points : price is over resistance 1
Type : Neutral
Timeframe : Weekly
Pivot points : price is over resistance 3
Type : Neutral
Timeframe : 1 hour
An analysis of the price chart with the Central Patterns scanner (detector of chart patterns and resistances and supports) shows several results that can have an impact on the price change:
Near horizontal resistance
Type : Bearish
Timeframe : 1 hour
Resistance of channel is broken
Type : Bullish
Timeframe : 1 hour
The Central Candlesticks scanner, specialised in Japanese candlesticks, did not identify any signals.
| S3 | S2 | S1 | Price | R1 | R2 | R3 | |
|---|---|---|---|---|---|---|---|
| ProTrendLines | 1.3686 | 1.3730 | 1.3745 | 1.3751 | 1.3782 | 1.3805 | 1.3819 |
| Change (%) | -0.47% | -0.15% | -0.04% | - | +0.23% | +0.39% | +0.49% |
| Change | -0.0065 | -0.0021 | -0.0006 | - | +0.0031 | +0.0054 | +0.0068 |
| Level | Intermediate | Major | Minor | - | Minor | Intermediate | Intermediate |
To determine price objectives, it is also possible to use the pivot points. Here is the price position in relation to pivot points:
| Pivot points | S3 | S2 | S1 | PP | R1 | R2 | R3 |
|---|---|---|---|---|---|---|---|
| Standard | 1.3590 | 1.3611 | 1.3639 | 1.3660 | 1.3688 | 1.3709 | 1.3737 |
| Camarilla | 1.3654 | 1.3658 | 1.3663 | 1.3667 | 1.3672 | 1.3676 | 1.3681 |
| Woodie | 1.3594 | 1.3613 | 1.3643 | 1.3662 | 1.3692 | 1.3711 | 1.3741 |
| Fibonacci | 1.3611 | 1.3630 | 1.3641 | 1.3660 | 1.3679 | 1.3690 | 1.3709 |
| Pivot points | S3 | S2 | S1 | PP | R1 | R2 | R3 |
|---|---|---|---|---|---|---|---|
| Standard | 1.3495 | 1.3565 | 1.3617 | 1.3687 | 1.3739 | 1.3809 | 1.3861 |
| Camarilla | 1.3637 | 1.3648 | 1.3659 | 1.3670 | 1.3681 | 1.3692 | 1.3704 |
| Woodie | 1.3487 | 1.3561 | 1.3609 | 1.3683 | 1.3731 | 1.3805 | 1.3853 |
| Fibonacci | 1.3565 | 1.3611 | 1.3640 | 1.3687 | 1.3733 | 1.3762 | 1.3809 |
| Pivot points | S3 | S2 | S1 | PP | R1 | R2 | R3 |
|---|---|---|---|---|---|---|---|
| Standard | 1.3238 | 1.3329 | 1.3432 | 1.3523 | 1.3626 | 1.3717 | 1.3820 |
| Camarilla | 1.3482 | 1.3499 | 1.3517 | 1.3535 | 1.3553 | 1.3571 | 1.3588 |
| Woodie | 1.3244 | 1.3332 | 1.3438 | 1.3526 | 1.3632 | 1.3720 | 1.3826 |
| Fibonacci | 1.3329 | 1.3403 | 1.3449 | 1.3523 | 1.3597 | 1.3643 | 1.3717 |
Numerical data
The following is the status of technical indicators and moving averages registered at the time this technical analysis was created:
| RSI (14): | 76.92 | |
| MACD (12,26,9): | 0.0021 | |
| Directional Movement: | 27.6138 | |
| AROON (14): | 78.5714 | |
| DEMA (21): | 1.3729 | |
| Parabolic SAR (0,02-0,02-0,2): | 1.3680 | |
| Elder Ray (13): | 0.0032 | |
| Super Trend (3,10): | 1.3696 | |
| Zig ZAG (10): | 1.3751 | |
| VORTEX (21): | 1.2833 | |
| Stochastique (14,3,5): | 90.16 | |
| TEMA (21): | 1.3744 | |
| Williams %R (14): | -3.70 | |
| Chande Momentum Oscillator (20): | 0.0071 | |
| Repulse (5,40,3): | 0.2422 | |
| ROCnROLL: | 1 | |
| TRIX (15,9): | 0.0151 | |
| Courbe Coppock: | 0.84 |
| MA7: | 1.3688 | |
| MA20: | 1.3683 | |
| MA50: | 1.3593 | |
| MA100: | 1.3508 | |
| MAexp7: | 1.3732 | |
| MAexp20: | 1.3704 | |
| MAexp50: | 1.3684 | |
| MAexp100: | 1.3683 | |
| Price / MA7: | +0.46% | |
| Price / MA20: | +0.50% | |
| Price / MA50: | +1.16% | |
| Price / MA100: | +1.80% | |
| Price / MAexp7: | +0.14% | |
| Price / MAexp20: | +0.34% | |
| Price / MAexp50: | +0.49% | |
| Price / MAexp100: | +0.50% |
News
Don't forget to follow the news on USD/CAD. At the time of publication of this analysis, the latest news was as follows:
-
 USD/CAD Forecast April 10, 2024
-
Technical Analysis: 05/03/2024 - USDCAD ticks higher within ascending channel
-
Technical Analysis: 29/03/2024 - USDCAD pauses four-day slide
-
Technical Analysis: 22/03/2024 - Is there stronger bullish trend for USDCAD?
-
USD/CAD Forecast March 20, 2024
About author

Online


Add a comment
Comments
0 comments on the analysis USD/CAD - 1H