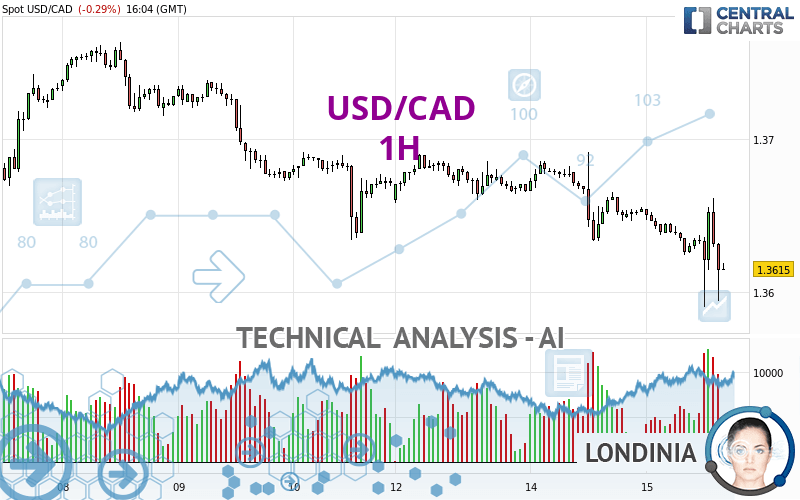
USD/CAD - 1H - Technical analysis published on 05/15/2024 (GMT)
- 65
- 0
Click here for a new analysis!
- Timeframe : 1H
- - Analysis generated on
- Status : LEVEL MAINTAINED

Summary of the analysis

Additional analysis
Quotes
USD/CAD rating 1.3615 CAD. The price is lower by -0.29% since the last closing and was traded between 1.3590 CAD and 1.3661 CAD over the period. The price is currently at +0.18% from its lowest and -0.34% from its highest.Here is a more detailed summary of the historical variations registered by USD/CAD:
Near a new LOW record (1 year)
Type : Bearish
Timeframe : Weekly
Near a new LOW record (1st january)
Type : Bearish
Timeframe : Weekly
Near a new HIGH record (1 month)
Type : Bullish
Timeframe : Weekly
New LOW record (1 month)
Type : Bearish
Timeframe : Weekly
Technical
Technical analysis of this 1H chart of USD/CAD indicates that the overall trend is strongly bearish. 92.86% of the signals given by moving averages are bearish. The overall trend is supported by the strong bearish signals from short-term moving averages. The Central Indicators scanner does not detect any result on moving averages that would impact this trend.
In fact, of the 18 technical indicators analysed by Central Analyzer, 4 are bullish, 4 are neutral and 10 are bearish. Caution: the Central Indicators scanner currently detects an excess:
CCI indicator is oversold : under -100
Type : Neutral
Timeframe : 1 hour
Pivot points : price is under support 1
Type : Neutral
Timeframe : Weekly
Pivot points : price is under support 3
Type : Neutral
Timeframe : 1 hour
MACD crosses DOWN its Moving Average
Type : Bearish
Timeframe : 1 hour
Williams %R indicator is back under -50
Type : Bearish
Timeframe : 1 hour
An analysis of the price chart with the Central Patterns scanner (detector of chart patterns and resistances and supports) shows several results that can have an impact on the price change:
Near resistance of channel
Type : Bearish
Timeframe : 1 hour
Near resistance of triangle
Type : Bearish
Timeframe : 1 hour
No result was found by the Central Candlesticks scanner on Japanese candlesticks.
| S3 | S2 | S1 | Price | R1 | R2 | R3 | |
|---|---|---|---|---|---|---|---|
| ProTrendLines | 1.3453 | 1.3525 | 1.3609 | 1.3615 | 1.3634 | 1.3648 | 1.3686 |
| Change (%) | -1.19% | -0.66% | -0.04% | - | +0.14% | +0.24% | +0.52% |
| Change | -0.0162 | -0.0090 | -0.0006 | - | +0.0019 | +0.0033 | +0.0071 |
| Level | Intermediate | Minor | Minor | - | Major | Minor | Major |
Pivot points can also be used to set your price objectives. Here is the price situation in relation to pivot points:
| Pivot points | S3 | S2 | S1 | PP | R1 | R2 | R3 |
|---|---|---|---|---|---|---|---|
| Standard | 1.3570 | 1.3601 | 1.3628 | 1.3659 | 1.3686 | 1.3717 | 1.3744 |
| Camarilla | 1.3638 | 1.3643 | 1.3649 | 1.3654 | 1.3659 | 1.3665 | 1.3670 |
| Woodie | 1.3567 | 1.3600 | 1.3625 | 1.3658 | 1.3683 | 1.3716 | 1.3741 |
| Fibonacci | 1.3601 | 1.3624 | 1.3637 | 1.3659 | 1.3682 | 1.3695 | 1.3717 |
| Pivot points | S3 | S2 | S1 | PP | R1 | R2 | R3 |
|---|---|---|---|---|---|---|---|
| Standard | 1.3487 | 1.3561 | 1.3616 | 1.3690 | 1.3745 | 1.3819 | 1.3874 |
| Camarilla | 1.3637 | 1.3648 | 1.3660 | 1.3672 | 1.3684 | 1.3696 | 1.3708 |
| Woodie | 1.3479 | 1.3556 | 1.3608 | 1.3685 | 1.3737 | 1.3814 | 1.3866 |
| Fibonacci | 1.3561 | 1.3610 | 1.3640 | 1.3690 | 1.3739 | 1.3769 | 1.3819 |
| Pivot points | S3 | S2 | S1 | PP | R1 | R2 | R3 |
|---|---|---|---|---|---|---|---|
| Standard | 1.3187 | 1.3333 | 1.3555 | 1.3701 | 1.3923 | 1.4069 | 1.4291 |
| Camarilla | 1.3677 | 1.3711 | 1.3744 | 1.3778 | 1.3812 | 1.3846 | 1.3879 |
| Woodie | 1.3226 | 1.3352 | 1.3594 | 1.3720 | 1.3962 | 1.4088 | 1.4330 |
| Fibonacci | 1.3333 | 1.3473 | 1.3560 | 1.3701 | 1.3841 | 1.3928 | 1.4069 |
Numerical data
The following is the status of the technical indicators and moving averages at the time of publication of this technical analysis:
| RSI (14): | 35.61 | |
| MACD (12,26,9): | -0.0009 | |
| Directional Movement: | -24.7222 | |
| AROON (14): | 14.2857 | |
| DEMA (21): | 1.3627 | |
| Parabolic SAR (0,02-0,02-0,2): | 1.3591 | |
| Elder Ray (13): | -0.0020 | |
| Super Trend (3,10): | 1.3597 | |
| Zig ZAG (10): | 1.3612 | |
| VORTEX (21): | 0.7903 | |
| Stochastique (14,3,5): | 61.37 | |
| TEMA (21): | 1.3625 | |
| Williams %R (14): | -69.01 | |
| Chande Momentum Oscillator (20): | -0.0027 | |
| Repulse (5,40,3): | -0.1147 | |
| ROCnROLL: | 2 | |
| TRIX (15,9): | -0.0084 | |
| Courbe Coppock: | 0.28 |
| MA7: | 1.3678 | |
| MA20: | 1.3693 | |
| MA50: | 1.3626 | |
| MA100: | 1.3540 | |
| MAexp7: | 1.3629 | |
| MAexp20: | 1.3638 | |
| MAexp50: | 1.3652 | |
| MAexp100: | 1.3666 | |
| Price / MA7: | -0.46% | |
| Price / MA20: | -0.57% | |
| Price / MA50: | -0.08% | |
| Price / MA100: | +0.55% | |
| Price / MAexp7: | -0.10% | |
| Price / MAexp20: | -0.17% | |
| Price / MAexp50: | -0.27% | |
| Price / MAexp100: | -0.37% |
News
The latest news and videos published on USD/CAD at the time of the analysis were as follows:
-
 Trade of the Week: Time to go long USDCAD?
-
USD/CAD Forecast May 8, 2024
-
USD/CAD Forecast May 2, 2024
-
USD/CAD Forecast April 10, 2024
-
Technical Analysis: 05/03/2024 - USDCAD ticks higher within ascending channel
About author

Online


Add a comment
Comments
0 comments on the analysis USD/CAD - 1H