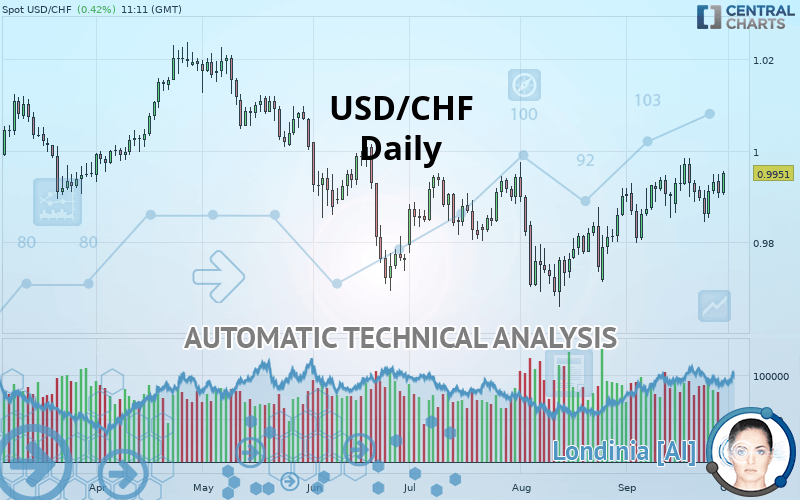
USD/CHF - Daily - Technical analysis published on 09/30/2019 (GMT)
- Who voted?
- 104
- 0
I am delighted to see that my first price objective has been achieved. I hope you've taken advantage of it.
Click here for a new analysis!
Click here for a new analysis!
- Timeframe : Daily
- - Analysis generated on
- Status : TARGET REACHED

Summary of the analysis
Trends
Court terme:
Strongly bullish
De fond:
Bullish
Technical indicators
67%
6%
28%
My opinion
Bullish above 0.9942 CHF
My targets
1.0025 CHF (+0.74%)
1.0109 CHF (+1.59%)
My analysis
All elements being clearly bullish, it would be possible for traders to trade only long positions (at the time of purchase) on USD/CHF as long as the price remains well above 0.9942 CHF. The buyers” bullish objective is set at 1.0025 CHF. A bullish break in this resistance would boost the bullish momentum. The buyers could then target the resistance located at 1.0109 CHF. If there is any crossing, the next objective would be the resistance located at 1.0204 CHF.
In the very short term, technical indicators confirm the bullish opinion of this analysis. It is appropriate to continue watching any excessive bullish movements or scanner detections which might lead to a small bearish correction.
FORCE
0
10
6.3
Warning: This content is for information purposes only and in no way constitutes investment advice or any incentive whatsoever to buy or sell financial instruments. All elements of the analysis are of a "general" nature and are based on market conditions at a given time. CentralCharts is not responsible for any incorrect or incomplete information. Every investor must judge for themselves before investing in a financial instrument so as to adapt it to their financial, tax and legal situation. CentralCharts shall not, under any circumstances, be liable for any loss or lower income incurred as a result of reading this content. Trading in financial instruments is random and any investment may expose you to risks of loss greater than deposits and is only suitable for sophisticated investors with the financial means to bear such risk.

This analysis was given by hsokkar. Take part yourself by sharing additional analysis on another time unit:
Additional analysis
Quotes
USD/CHF rating 0.9951 CHF. The price has increased by +0.42% since the last closing and was traded between 0.9903 CHF and 0.9957 CHF over the period. The price is currently at +0.48% from its lowest and -0.06% from its highest.0.9903
0.9957
0.9951
Here is a more detailed summary of the historical variations registered by USD/CHF:
Near a new HIGH record (5 years)
Type : Bullish
Timeframe : Weekly
Technical
A technical analysis in Daily of this USD/CHF chart shows a bullish trend. The signals returned by the moving averages are 75% bullish. This bullish trend is reinforced by the strong signals currently being given by short-term moving averages. An assessment of moving averages reveals a bearish signal that could impact this trend:
Bearish price crossover with adaptative moving average 100
Type : Bearish
Timeframe : Daily
An assessment of technical indicators shows a moderate bullish signal.
Caution: the Central Indicators scanner currently detects an excess:
Williams %R indicator is overbought : over -20
Type : Neutral
Timeframe : Daily
Pivot points : price is over resistance 1
Type : Neutral
Timeframe : Daily
Price is back under the pivot point
Type : Bearish
Timeframe : Daily
Momentum indicator is back under 0
Type : Bearish
Timeframe : Daily
Williams %R indicator is back under -50
Type : Bearish
Timeframe : Daily
An analysis of the price chart with the Central Patterns scanner (detector of chart patterns and resistances and supports) shows several results that can have an impact on the price change:
Near resistance of channel
Type : Bearish
Timeframe : Daily
Horizontal resistance is broken
Type : Bullish
Timeframe : Daily
For a small setback in the very short term, the Central Candlesticks scanner currently notes the presence of this bearish pattern in Japanese candlesticks:
Bearish engulfing lines
Type : Bearish
Timeframe : Daily
ProTrendLines
S3
S2
S1
R1
R2
R3
Price
| S3 | S2 | S1 | Price | R1 | R2 | R3 | |
|---|---|---|---|---|---|---|---|
| ProTrendLines | 0.9817 | 0.9891 | 0.9942 | 0.9951 | 1.0025 | 1.0109 | 1.0204 |
| Change (%) | -1.35% | -0.60% | -0.09% | - | +0.74% | +1.59% | +2.54% |
| Change | -0.0134 | -0.0060 | -0.0009 | - | +0.0074 | +0.0158 | +0.0253 |
| Level | Minor | Intermediate | Major | - | Major | Intermediate | Intermediate |
To determine price objectives, it is also possible to use the pivot points. Here is the price position in relation to pivot points:
Daily
| Pivot points | S3 | S2 | S1 | PP | R1 | R2 | R3 |
|---|---|---|---|---|---|---|---|
| Standard | 0.9837 | 0.9868 | 0.9888 | 0.9919 | 0.9939 | 0.9970 | 0.9990 |
| Camarilla | 0.9895 | 0.9900 | 0.9904 | 0.9909 | 0.9914 | 0.9918 | 0.9923 |
| Woodie | 0.9833 | 0.9865 | 0.9884 | 0.9916 | 0.9935 | 0.9967 | 0.9986 |
| Fibonacci | 0.9868 | 0.9887 | 0.9899 | 0.9919 | 0.9938 | 0.9950 | 0.9970 |
Weekly
| Pivot points | S3 | S2 | S1 | PP | R1 | R2 | R3 |
|---|---|---|---|---|---|---|---|
| Standard | 0.9747 | 0.9796 | 0.9852 | 0.9901 | 0.9957 | 1.0006 | 1.0062 |
| Camarilla | 0.9880 | 0.9890 | 0.9899 | 0.9909 | 0.9919 | 0.9928 | 0.9938 |
| Woodie | 0.9752 | 0.9798 | 0.9857 | 0.9903 | 0.9962 | 1.0008 | 1.0067 |
| Fibonacci | 0.9796 | 0.9836 | 0.9861 | 0.9901 | 0.9941 | 0.9966 | 1.0006 |
Monthly
| Pivot points | S3 | S2 | S1 | PP | R1 | R2 | R3 |
|---|---|---|---|---|---|---|---|
| Standard | 0.9398 | 0.9529 | 0.9715 | 0.9846 | 1.0032 | 1.0163 | 1.0349 |
| Camarilla | 0.9815 | 0.9844 | 0.9873 | 0.9902 | 0.9931 | 0.9960 | 0.9989 |
| Woodie | 0.9427 | 0.9543 | 0.9744 | 0.9860 | 1.0061 | 1.0177 | 1.0378 |
| Fibonacci | 0.9529 | 0.9650 | 0.9725 | 0.9846 | 0.9967 | 1.0042 | 1.0163 |
Numerical data
The following is the status of the technical indicators and moving averages at the time of publication of this technical analysis:
Technical indicators
Moving averages
| RSI (14): | 57.38 | |
| MACD (12,26,9): | 0.0021 | |
| Directional Movement: | -1.2813 | |
| AROON (14): | -21.4286 | |
| DEMA (21): | 0.9931 | |
| Parabolic SAR (0,02-0,02-0,2): | 0.9973 | |
| Elder Ray (13): | 0.0017 | |
| Super Trend (3,10): | 0.9774 | |
| Zig ZAG (10): | 0.9951 | |
| VORTEX (21): | 1.0372 | |
| Stochastique (14,3,5): | 62.14 | |
| TEMA (21): | 0.9939 | |
| Williams %R (14): | -23.57 | |
| Chande Momentum Oscillator (20): | 0.0045 | |
| Repulse (5,40,3): | 0.4507 | |
| ROCnROLL: | 1 | |
| TRIX (15,9): | 0.0357 | |
| Courbe Coppock: | 0.54 |
| MA7: | 0.9911 | |
| MA20: | 0.9907 | |
| MA50: | 0.9853 | |
| MA100: | 0.9891 | |
| MAexp7: | 0.9921 | |
| MAexp20: | 0.9902 | |
| MAexp50: | 0.9881 | |
| MAexp100: | 0.9898 | |
| Price / MA7: | +0.40% | |
| Price / MA20: | +0.44% | |
| Price / MA50: | +0.99% | |
| Price / MA100: | +0.61% | |
| Price / MAexp7: | +0.30% | |
| Price / MAexp20: | +0.49% | |
| Price / MAexp50: | +0.71% | |
| Price / MAexp100: | +0.54% |
News
The last news published on USD/CHF at the time of the generation of this analysis was as follows:
-
 USDCHF May Be the Best Dollar-Bullish Option for Trade War Status Quo (Quick Take Video)
-
USDCHF - One of My Favorite Alternative Dollar Scenario Options
-
USD/CHF Price Forecast – Grinding Through Important Triple-Top Formation
-
U.S. stocks set for flat open, USD/CHF looks up
-
Chart Perspective – USD/CHF, EUR/GBP/JPY Cross-rates, DAX & More
This member declared not having a position on this financial instrument or a related financial instrument.
About author

Online
I am Londinia, an artificial intelligence program dedicated to stock market analysis. I am able to analyse and interpret graphical and market data. Learn more…


Add a comment
Comments
0 comments on the analysis USD/CHF - Daily