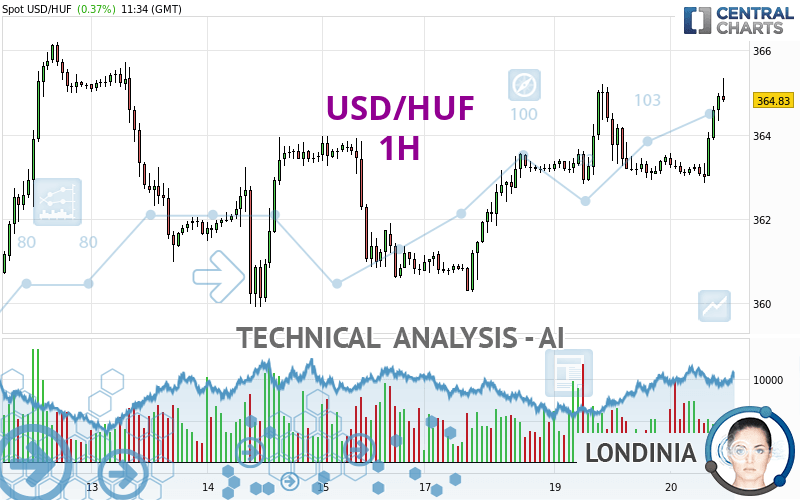
USD/HUF - 1H - Technical analysis published on 03/20/2024 (GMT)
- 87
- 0
Click here for a new analysis!
- Timeframe : 1H
- - Analysis generated on
- Status : INVALID
Summary of the analysis

Additional analysis
Quotes
The USD/HUF rating is 364.83 HUF. The price registered an increase of +0.37% on the session and was between 362.85 HUF and 365.35 HUF. This implies that the price is at +0.55% from its lowest and at -0.14% from its highest.The Central Gaps scanner detects a bearish opening. A small advantage for sellers in the very short term.
Bearish opening
Type : Bearish
Timeframe : Openning
A study of price movements over other periods shows the following variations:
Near a new HIGH record (1 year)
Type : Bullish
Timeframe : Weekly
Near a new HIGH record (1st january)
Type : Bullish
Timeframe : Weekly
Near a new LOW record (1 month)
Type : Bearish
Timeframe : Weekly
Technical
A technical analysis in 1H of this USD/HUF chart shows a strongly bullish trend. The signals given by the moving averages are 92.86% bullish. This strong bullish trend is confirmed by the strong signals currently being given by short-term moving averages. The Central Indicators scanner does not detect any result on moving averages that would impact this trend.
The probability of a further increase is high given the direction of the technical indicators.
Caution: the Central Indicators scanner currently detects an excess:
RSI indicator is overbought : over 70
Type : Neutral
Timeframe : 1 hour
CCI indicator is overbought : over 100
Type : Neutral
Timeframe : 1 hour
Previous candle closed over Bollinger bands
Type : Neutral
Timeframe : 1 hour
Williams %R indicator is overbought : over -20
Type : Neutral
Timeframe : 1 hour
Pivot points : price is over resistance 1
Type : Neutral
Timeframe : 1 hour
Pivot points : price is over resistance 1
Type : Neutral
Timeframe : Weekly
An analysis of the price chart with the Central Patterns scanner (detector of chart patterns and resistances and supports) shows several results that can have an impact on the price change:
Near horizontal resistance
Type : Bearish
Timeframe : 1 hour
Resistance of channel is broken
Type : Bullish
Timeframe : 1 hour
No result was found by the Central Candlesticks scanner on Japanese candlesticks.
| S3 | S2 | S1 | Price | R1 | R2 | R3 | |
|---|---|---|---|---|---|---|---|
| ProTrendLines | 360.63 | 362.42 | 363.96 | 364.83 | 365.19 | 366.20 | 369.17 |
| Change (%) | -1.15% | -0.66% | -0.24% | - | +0.10% | +0.38% | +1.19% |
| Change | -4.20 | -2.41 | -0.87 | - | +0.36 | +1.37 | +4.34 |
| Level | Major | Major | Intermediate | - | Minor | Minor | Minor |
Pivot points can also be used to set your price objectives. Here is the price situation in relation to pivot points:
| Pivot points | S3 | S2 | S1 | PP | R1 | R2 | R3 |
|---|---|---|---|---|---|---|---|
| Standard | 360.11 | 361.47 | 362.47 | 363.83 | 364.83 | 366.19 | 367.19 |
| Camarilla | 362.82 | 363.04 | 363.25 | 363.47 | 363.69 | 363.90 | 364.12 |
| Woodie | 359.93 | 361.38 | 362.29 | 363.74 | 364.65 | 366.10 | 367.01 |
| Fibonacci | 361.47 | 362.37 | 362.93 | 363.83 | 364.73 | 365.29 | 366.19 |
| Pivot points | S3 | S2 | S1 | PP | R1 | R2 | R3 |
|---|---|---|---|---|---|---|---|
| Standard | 351.47 | 355.50 | 358.14 | 362.17 | 364.81 | 368.84 | 371.48 |
| Camarilla | 358.95 | 359.56 | 360.17 | 360.78 | 361.39 | 362.00 | 362.61 |
| Woodie | 350.78 | 355.15 | 357.45 | 361.82 | 364.12 | 368.49 | 370.79 |
| Fibonacci | 355.50 | 358.05 | 359.62 | 362.17 | 364.72 | 366.29 | 368.84 |
| Pivot points | S3 | S2 | S1 | PP | R1 | R2 | R3 |
|---|---|---|---|---|---|---|---|
| Standard | 342.45 | 346.86 | 355.14 | 359.55 | 367.83 | 372.24 | 380.52 |
| Camarilla | 359.93 | 361.09 | 362.26 | 363.42 | 364.58 | 365.75 | 366.91 |
| Woodie | 344.39 | 347.83 | 357.08 | 360.52 | 369.77 | 373.21 | 382.46 |
| Fibonacci | 346.86 | 351.71 | 354.70 | 359.55 | 364.40 | 367.39 | 372.24 |
Numerical data
The following is the status of the technical indicators and moving averages at the time of publication of this technical analysis:
| RSI (14): | 73.68 | |
| MACD (12,26,9): | 0.3300 | |
| Directional Movement: | 23.58 | |
| AROON (14): | 28.57 | |
| DEMA (21): | 364.10 | |
| Parabolic SAR (0,02-0,02-0,2): | 363.12 | |
| Elder Ray (13): | 1.15 | |
| Super Trend (3,10): | 363.56 | |
| Zig ZAG (10): | 365.23 | |
| VORTEX (21): | 1.1800 | |
| Stochastique (14,3,5): | 95.42 | |
| TEMA (21): | 364.25 | |
| Williams %R (14): | -5.60 | |
| Chande Momentum Oscillator (20): | 1.71 | |
| Repulse (5,40,3): | 0.3800 | |
| ROCnROLL: | 1 | |
| TRIX (15,9): | 0.0000 | |
| Courbe Coppock: | 0.48 |
| MA7: | 363.28 | |
| MA20: | 362.06 | |
| MA50: | 358.34 | |
| MA100: | 354.13 | |
| MAexp7: | 364.28 | |
| MAexp20: | 363.74 | |
| MAexp50: | 363.31 | |
| MAexp100: | 362.95 | |
| Price / MA7: | +0.43% | |
| Price / MA20: | +0.77% | |
| Price / MA50: | +1.81% | |
| Price / MA100: | +3.02% | |
| Price / MAexp7: | +0.15% | |
| Price / MAexp20: | +0.30% | |
| Price / MAexp50: | +0.42% | |
| Price / MAexp100: | +0.52% |
About author

Online


Add a comment
Comments
0 comments on the analysis USD/HUF - 1H