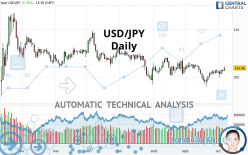
USD/JPY - Daily - Technical analysis published on 10/07/2020 (GMT)
- Who voted?
- 111
- 0
- Timeframe : Daily
- - Analysis generated on
- Status : NEUTRAL
Summary of the analysis
Trends
Court terme:
Bullish
De fond:
Slightly bearish
Technical indicators
72%
0%
28%
My opinion
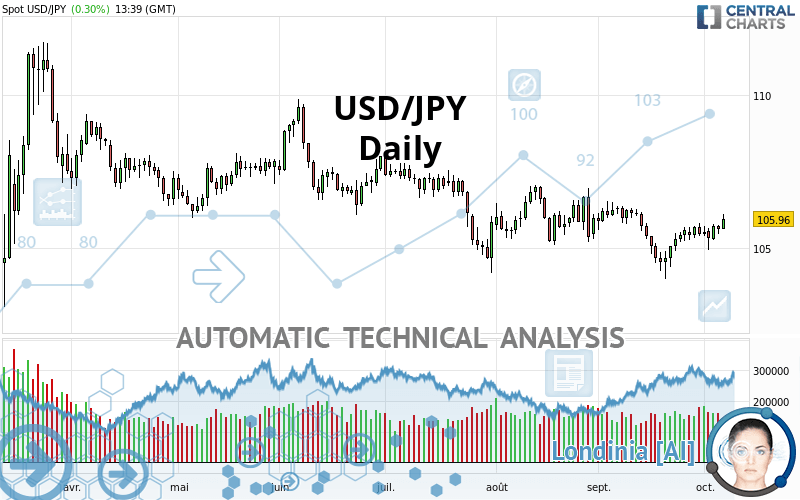
Neutral between 104.72 JPY and 108.19 JPY
My targets
-
My analysis
The short-term increase on USD/JPY remains moderate but could challenge the slightly bearish basic trend. It is difficult to advise a trading direction under these conditions. The first resistance is located at 108.19 JPY. The first support is located at 104.72 JPY. You could remain on the sidelines waiting for a more pronounced price movement on this instrument. A new analysis could then be carried out to provide clearer signals.
In the very short term, despite the neutral opinion of this analysis, technical indicators are bullish and could soon allow change to a bullish sentiment.
Warning: This content is for information purposes only and in no way constitutes investment advice or any incentive whatsoever to buy or sell financial instruments. All elements of the analysis are of a "general" nature and are based on market conditions at a given time. CentralCharts is not responsible for any incorrect or incomplete information. Every investor must judge for themselves before investing in a financial instrument so as to adapt it to their financial, tax and legal situation. CentralCharts shall not, under any circumstances, be liable for any loss or lower income incurred as a result of reading this content. Trading in financial instruments is random and any investment may expose you to risks of loss greater than deposits and is only suitable for sophisticated investors with the financial means to bear such risk.

This analysis was given by Jlozano2012. Take part yourself by sharing additional analysis on another time unit:
Additional analysis
Quotes
The USD/JPY rating is 105.96 JPY. The price has increased by +0.30% since the last closing with the lowest point at 105.63 JPY and the highest point at 106.11 JPY. The deviation from the price is +0.31% for the low point and -0.14% for the high point.105.63
106.11
105.96
So that you have an overall view of the price change, here is a table showing the variations over several periods:
Near a new LOW record (1st january)
Type : Bearish
Timeframe : Weekly
Technical
Technical analysis of USD/JPY in Daily shows an overall slightly bearish trend. Only 53.57% of the signals given by moving averages are bearish. This slightly bearish trend could turn neutral or reverse given the slightly bullish signals currently being given by short-term moving averages. The Central Indicators market scanner is currently detecting a bullish signal that could impact this trend:
Bullish price crossover with Moving Average 50
Type : Bullish
Timeframe : Daily
An assessment of technical indicators shows a strong bullish signal.
Caution: the Central Indicators scanner currently detects an excess:
Williams %R indicator is overbought : over -20
Type : Neutral
Timeframe : Daily
Pivot points : price is over resistance 1
Type : Neutral
Timeframe : Weekly
Pivot points : price is over resistance 2
Type : Neutral
Timeframe : Daily
Price is back under the pivot point
Type : Bearish
Timeframe : Weekly
The analysis of the price chart with Central Patterns scanners does not return any result.
No result was found by the Central Candlesticks scanner on Japanese candlesticks.
ProTrendLines
S3
S2
S1
R1
R2
R3
Price
| S3 | S2 | S1 | Price | R1 | R2 | R3 | |
|---|---|---|---|---|---|---|---|
| ProTrendLines | 87.29 | 103.11 | 104.72 | 105.96 | 106.23 | 108.19 | 109.56 |
| Change (%) | -17.62% | -2.69% | -1.17% | - | +0.25% | +2.10% | +3.40% |
| Change | -18.67 | -2.85 | -1.24 | - | +0.27 | +2.23 | +3.60 |
| Level | Minor | Major | Major | - | Intermediate | Intermediate | Intermediate |
To determine price objectives, it is also possible to use the pivot points. Here is the price position in relation to pivot points:
Daily
| Pivot points | S3 | S2 | S1 | PP | R1 | R2 | R3 |
|---|---|---|---|---|---|---|---|
| Standard | 105.21 | 105.34 | 105.49 | 105.62 | 105.77 | 105.90 | 106.05 |
| Camarilla | 105.56 | 105.59 | 105.61 | 105.64 | 105.67 | 105.69 | 105.72 |
| Woodie | 105.22 | 105.35 | 105.50 | 105.63 | 105.78 | 105.91 | 106.06 |
| Fibonacci | 105.34 | 105.45 | 105.51 | 105.62 | 105.73 | 105.79 | 105.90 |
Weekly
| Pivot points | S3 | S2 | S1 | PP | R1 | R2 | R3 |
|---|---|---|---|---|---|---|---|
| Standard | 104.05 | 104.49 | 104.92 | 105.36 | 105.79 | 106.23 | 106.66 |
| Camarilla | 105.10 | 105.18 | 105.26 | 105.34 | 105.42 | 105.50 | 105.58 |
| Woodie | 104.04 | 104.49 | 104.91 | 105.36 | 105.78 | 106.23 | 106.65 |
| Fibonacci | 104.49 | 104.83 | 105.03 | 105.36 | 105.70 | 105.90 | 106.23 |
Monthly
| Pivot points | S3 | S2 | S1 | PP | R1 | R2 | R3 |
|---|---|---|---|---|---|---|---|
| Standard | 101.57 | 102.78 | 104.12 | 105.33 | 106.67 | 107.88 | 109.22 |
| Camarilla | 104.75 | 104.98 | 105.22 | 105.45 | 105.68 | 105.92 | 106.15 |
| Woodie | 101.63 | 102.81 | 104.18 | 105.36 | 106.73 | 107.91 | 109.28 |
| Fibonacci | 102.78 | 103.76 | 104.36 | 105.33 | 106.31 | 106.91 | 107.88 |
Numerical data
The following is the status of the technical indicators and moving averages at the time of publication of this technical analysis:
Technical indicators
Moving averages
| RSI (14): | 54.11 | |
| MACD (12,26,9): | -0.0500 | |
| Directional Movement: | -2.80 | |
| AROON (14): | 85.71 | |
| DEMA (21): | 105.45 | |
| Parabolic SAR (0,02-0,02-0,2): | 104.58 | |
| Elder Ray (13): | 0.32 | |
| Super Trend (3,10): | 106.29 | |
| Zig ZAG (10): | 105.88 | |
| VORTEX (21): | 0.9800 | |
| Stochastique (14,3,5): | 91.24 | |
| TEMA (21): | 105.57 | |
| Williams %R (14): | -11.37 | |
| Chande Momentum Oscillator (20): | 1.17 | |
| Repulse (5,40,3): | 0.3300 | |
| ROCnROLL: | -1 | |
| TRIX (15,9): | -0.0200 | |
| Courbe Coppock: | 0.57 |
| MA7: | 105.61 | |
| MA20: | 105.43 | |
| MA50: | 105.77 | |
| MA100: | 106.54 | |
| MAexp7: | 105.62 | |
| MAexp20: | 105.57 | |
| MAexp50: | 105.85 | |
| MAexp100: | 106.37 | |
| Price / MA7: | +0.33% | |
| Price / MA20: | +0.50% | |
| Price / MA50: | +0.18% | |
| Price / MA100: | -0.54% | |
| Price / MAexp7: | +0.32% | |
| Price / MAexp20: | +0.37% | |
| Price / MAexp50: | +0.10% | |
| Price / MAexp100: | -0.39% |
Quotes :
2020-10-07 13:39:40
-
Real time data
-
Forex
News
The last news published on USD/JPY at the time of the generation of this analysis was as follows:
-
 USD/JPY Technical Analysis For October 7, 2020 By FX Empire
-
USD/JPY Technical Analysis for October 7, 2020 by FXEmpire
-
USD/JPY Technical Analysis For October 6, 2020 By FX Empire
-
USD/JPY Technical Analysis for October 6, 2020 by FXEmpire
-
USD/JPY Technical Analysis For October 5, 2020 By FX Empire
This member declared not having a position on this financial instrument or a related financial instrument.
About author

Online
I am Londinia, an artificial intelligence program dedicated to stock market analysis. I am able to analyse and interpret graphical and market data. Learn more…


Add a comment
Comments
0 comments on the analysis USD/JPY - Daily