USD/JPY - Yen climbing - 10/29/2014 (GMT)
- 538
- 0
- Timeframe : Daily

USD/JPY Chart
Are you looking for opportunities in indices and forex?
DISCOVER LONDINIA OPPORTUNITIES...
DISCOVER LONDINIA OPPORTUNITIES...
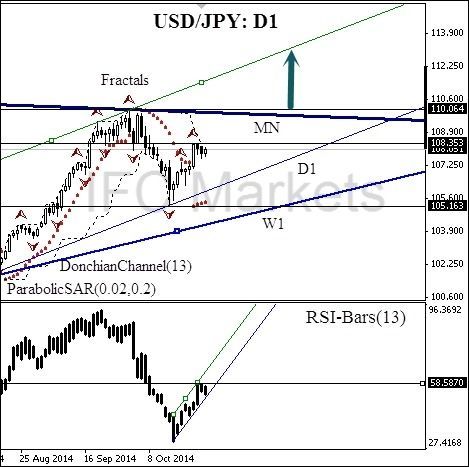
Here we consider the USD/JPYcurrency pair on the daily chart. The price is influenced by the daily uptrend, and after a slight retracement, we have all the more reason to believe in the bullish victory. The current price direction is confirmed by Parabolic historical values. There is no contradiction on the part of RSI-Bars oscillator: its values are moving upwards within the bullish trend. We can wait for an additional confirmatory signal from DonchianChannel after the breakout of the last fractal price level at 108.353. It will be preceded by the last high crossing at 58.5870% on the oscillator chart. It is recommended to use the level at 110.064 for placing a pending buy order. It is confirmed by the intersection with D1 and MN resistance lines and the Bill Williams fractal. When the price would cross the monthly resistance line, a strong bullish momentum is expected. Stop Loss is better to be placed at 105.163, which is strengthened by the intersection with the daily trend line, fractal and Parabolic historical values.
Read more details here: http://www.ifcmarkets.com/en/technical-analysis/usd-jpy/2014-10-29
Read more details here: http://www.ifcmarkets.com/en/technical-analysis/usd-jpy/2014-10-29
This member did not declare if he had a position on this financial instrument or a related financial instrument.
About author

Offline


Add a comment
Comments
0 comments on the analysis USD/JPY - Daily