USD/JPY - Bulls Push the Price Higher at Almost 2-Month High - 05/09/2017 (GMT)
- Who voted?
- 545
- 0
- Timeframe : Daily
USD/JPY Chart
Are you looking for opportunities in indices and forex?
DISCOVER LONDINIA OPPORTUNITIES...
DISCOVER LONDINIA OPPORTUNITIES...
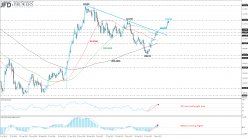
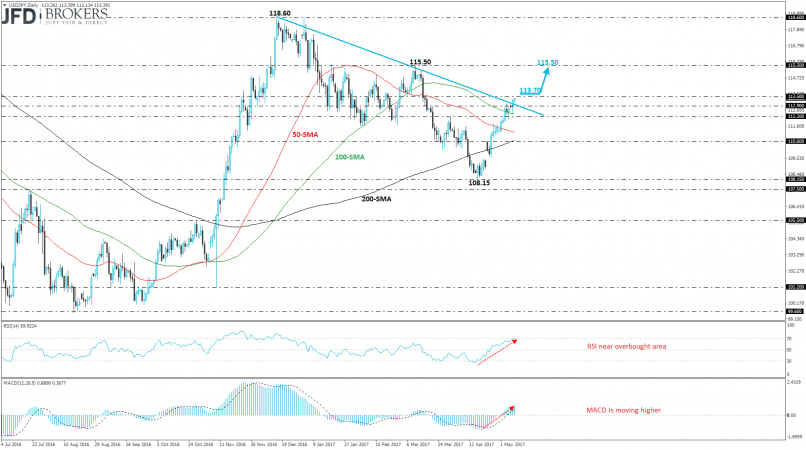
Over the last couple of hours, the USD/JPY pair is trying to hit the 113.50 resistance level while it has a successful run above the descending trend line which is holding for more than five months. The U.S. dollar rose 0.57% so far this week and surged 1% in the previous as the U.S. employment report was better than expected. In addition, the pair printed a fresh almost two month high at 113.46 early this morning. If the bulls manage to push the price above 113.50, the next level to watch will be the 115.50 strong barrier.
From the technical point of view, during yesterday’s trading session, the pair had a rebound on the 100-daily SMA and almost met the 100-weekly SMA near 113.50. On the short-term timeframe, the RSI indicator is moving higher with stationary movement and is approaching the overbought area. The MACD oscillator jumped above its trigger line and is strengthening.
From the technical point of view, during yesterday’s trading session, the pair had a rebound on the 100-daily SMA and almost met the 100-weekly SMA near 113.50. On the short-term timeframe, the RSI indicator is moving higher with stationary movement and is approaching the overbought area. The MACD oscillator jumped above its trigger line and is strengthening.
This member did not declare if he had a position on this financial instrument or a related financial instrument.
About author

Offline


Add a comment
Comments
0 comments on the analysis USD/JPY - Daily