USD/JPY - USD/JPY Struggles in The Trading Range 107.10 - 114.40 - 11/21/2017 (GMT)
- Who voted?
- 379
- 0
- Timeframe : Weekly

USD/JPY Chart
Are you looking for opportunities in indices and forex?
DISCOVER LONDINIA OPPORTUNITIES...
DISCOVER LONDINIA OPPORTUNITIES...
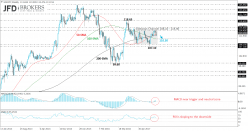
Over the last eight months, the USD/JPY pair has established and traded within a consolidation area with upper boundary the 114.40 resistance level and lower boundary the 108.10 support level. Currently, the pair is testing the 50-week SMA as well as the 200-week SMA, within the channel. As it stands, if the bulls are strong enough to push the price further up, we would expect extensions towards the 118.65 strong level. A failure to create bullish movement, then we should prompt a move lower towards the lower band or until the 100-week SMA, near 110.50.Remaining on the medium-term timeframe, the price completed two negative weeks in a row and the technical indicators are moving lower. The MACD oscillator has a weak momentum near the zero line and the RSI indicator is pointing down in the bullish zone. Bearish attitude is also confirmed in the daily timeframe for the short-term traders.
This member declared not having a position on this financial instrument or a related financial instrument.
About author

Offline


Add a comment
Comments
0 comments on the analysis USD/JPY - Weekly