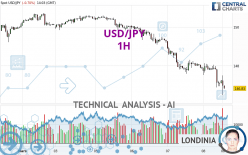
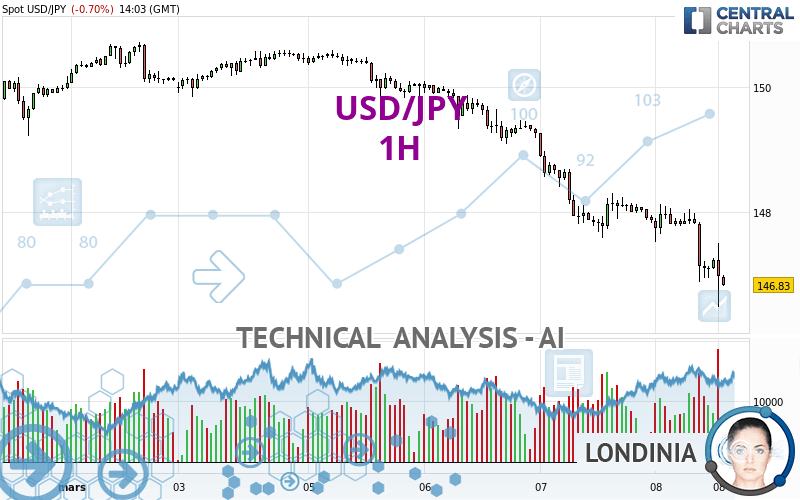
USD/JPY - 1H - Technical analysis published on 03/08/2024 (GMT)
- 92
- 0
Click here for a new analysis!
- Timeframe : 1H
- - Analysis generated on
- Status : LEVEL MAINTAINED
Summary of the analysis

Additional analysis
Quotes
The USD/JPY price is 146.82 JPY. The price is lower by -0.71% since the last closing and was traded between 146.48 JPY and 148.12 JPY over the period. The price is currently at +0.23% from its lowest and -0.88% from its highest.A bearish opening was detected by the Central Gaps scanner. Sellers are trying to impose a bearish trend in the very short term.
Bearish opening
Type : Bearish
Timeframe : Openning
So that you have an overall view of the price change, here is a table showing the variations over several periods:
Near a new HIGH record (5 years)
Type : Bullish
Timeframe : Weekly
Near a new HIGH record (1 year)
Type : Bullish
Timeframe : Weekly
Near a new LOW record (1st january)
Type : Bearish
Timeframe : Weekly
Near a new HIGH record (1 month)
Type : Bullish
Timeframe : Weekly
New LOW record (1 month)
Type : Bearish
Timeframe : Weekly
Technical
A technical analysis in 1H of this USD/JPY chart shows a sharp bearish trend. 92.86% of the signals given by moving averages are bearish. The overall trend is supported by the strong bearish signals from short-term moving averages. An assessment of moving averages reveals a bearish signal that could impact this trend:
Moving Average bearish crossovers : AMA20 & AMA50
Type : Bearish
Timeframe : 1 hour
In fact, according to the parameters integrated into the Central Analyzer system, 11 technical indicators out of 18 analysed are currently bearish. Caution: the Central Indicators scanner currently detects an excess:
RSI indicator is oversold : under 20
Type : Neutral
Timeframe : 1 hour
CCI indicator is oversold : under -100
Type : Neutral
Timeframe : 1 hour
Williams %R indicator is oversold : under -80
Type : Neutral
Timeframe : 1 hour
Pivot points : price is under support 3
Type : Neutral
Timeframe : 1 hour
Pivot points : price is under support 3
Type : Neutral
Timeframe : Weekly
The Central Patterns scanner, which studies chart patterns, resistances and supports, has identified this signal:
Near support of channel
Type : Bullish
Timeframe : 1 hour
For a small setback in the very short term, the Central Candlesticks scanner currently notes the presence of this bearish pattern in Japanese candlesticks:
Long black line
Type : Bearish
Timeframe : 1 hour
| S3 | S2 | S1 | Price | R1 | R2 | R3 | |
|---|---|---|---|---|---|---|---|
| ProTrendLines | 141.03 | 144.74 | 146.44 | 146.82 | 147.59 | 148.28 | 149.21 |
| Change (%) | -3.94% | -1.42% | -0.26% | - | +0.52% | +0.99% | +1.63% |
| Change | -5.79 | -2.08 | -0.38 | - | +0.77 | +1.46 | +2.39 |
| Level | Intermediate | Intermediate | Intermediate | - | Intermediate | Intermediate | Minor |
To determine price objectives, it is also possible to use the pivot points. Here is the price position in relation to pivot points:
| Pivot points | S3 | S2 | S1 | PP | R1 | R2 | R3 |
|---|---|---|---|---|---|---|---|
| Standard | 145.55 | 146.57 | 147.22 | 148.24 | 148.89 | 149.91 | 150.56 |
| Camarilla | 147.41 | 147.56 | 147.72 | 147.87 | 148.02 | 148.18 | 148.33 |
| Woodie | 145.37 | 146.48 | 147.04 | 148.15 | 148.71 | 149.82 | 150.38 |
| Fibonacci | 146.57 | 147.21 | 147.60 | 148.24 | 148.88 | 149.27 | 149.91 |
| Pivot points | S3 | S2 | S1 | PP | R1 | R2 | R3 |
|---|---|---|---|---|---|---|---|
| Standard | 147.62 | 148.42 | 149.26 | 150.06 | 150.90 | 151.70 | 152.54 |
| Camarilla | 149.66 | 149.81 | 149.96 | 150.11 | 150.26 | 150.41 | 150.56 |
| Woodie | 147.65 | 148.43 | 149.29 | 150.07 | 150.93 | 151.71 | 152.57 |
| Fibonacci | 148.42 | 149.04 | 149.43 | 150.06 | 150.68 | 151.07 | 151.70 |
| Pivot points | S3 | S2 | S1 | PP | R1 | R2 | R3 |
|---|---|---|---|---|---|---|---|
| Standard | 142.01 | 143.95 | 147.01 | 148.95 | 152.01 | 153.95 | 157.01 |
| Camarilla | 148.70 | 149.15 | 149.61 | 150.07 | 150.53 | 150.99 | 151.45 |
| Woodie | 142.57 | 144.23 | 147.57 | 149.23 | 152.57 | 154.23 | 157.57 |
| Fibonacci | 143.95 | 145.86 | 147.04 | 148.95 | 150.86 | 152.04 | 153.95 |
Numerical data
The following are the details of the technical indicators and moving averages that were collected to generate this technical analysis:
| RSI (14): | 22.41 | |
| MACD (12,26,9): | -0.3400 | |
| Directional Movement: | -31.05 | |
| AROON (14): | -85.71 | |
| DEMA (21): | 147.19 | |
| Parabolic SAR (0,02-0,02-0,2): | 147.98 | |
| Elder Ray (13): | -0.46 | |
| Super Trend (3,10): | 147.88 | |
| Zig ZAG (10): | 146.79 | |
| VORTEX (21): | 0.7500 | |
| Stochastique (14,3,5): | 22.44 | |
| TEMA (21): | 147.14 | |
| Williams %R (14): | -79.27 | |
| Chande Momentum Oscillator (20): | -1.14 | |
| Repulse (5,40,3): | -0.3800 | |
| ROCnROLL: | 2 | |
| TRIX (15,9): | -0.0300 | |
| Courbe Coppock: | 0.96 |
| MA7: | 149.23 | |
| MA20: | 149.94 | |
| MA50: | 147.92 | |
| MA100: | 147.76 | |
| MAexp7: | 147.23 | |
| MAexp20: | 147.63 | |
| MAexp50: | 148.23 | |
| MAexp100: | 148.87 | |
| Price / MA7: | -1.61% | |
| Price / MA20: | -2.08% | |
| Price / MA50: | -0.74% | |
| Price / MA100: | -0.64% | |
| Price / MAexp7: | -0.27% | |
| Price / MAexp20: | -0.54% | |
| Price / MAexp50: | -0.94% | |
| Price / MAexp100: | -1.37% |
News
The last news published on USD/JPY at the time of the generation of this analysis was as follows:
-
 USD/JPY Forecast March 8, 2024
-
USD/JPY Daily Forecast and Technical Analysis for March 07, 2024, by Chris Lewis for FX Empire
-
Technical Analysis: 07/03/2024 - USDJPY correction picks up speed
-
USD/JPY Daily Forecast and Technical Analysis for March 06, 2024, by Chris Lewis for FX Empire
-
USD/JPY Daily Forecast and Technical Analysis for March 05, 2024, by Chris Lewis for FX Empire
About author

Online


Add a comment
Comments
0 comments on the analysis USD/JPY - 1H