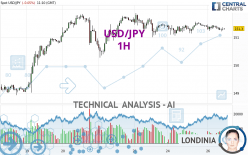
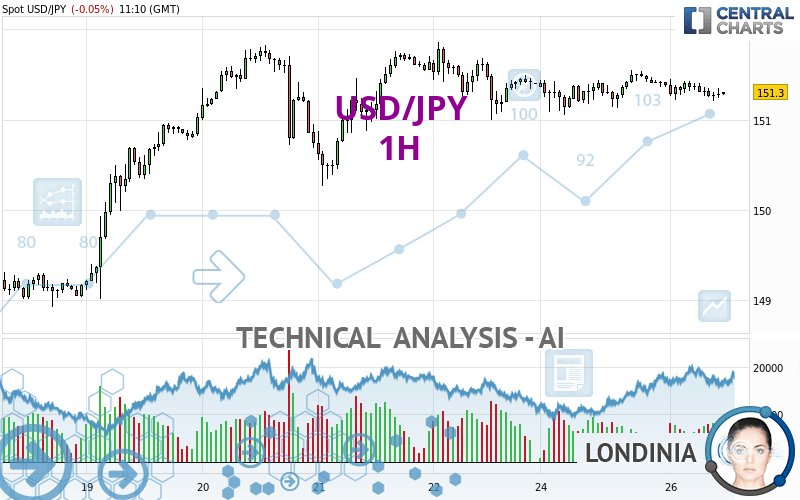
USD/JPY - 1H - Technical analysis published on 03/26/2024 (GMT)
- 78
- 0
I am pleased to note that the threshold for invalidation has been maintained for 20 Candlesticks.
Click here for a new analysis!
Click here for a new analysis!
- Timeframe : 1H
- - Analysis generated on
- Status : LEVEL MAINTAINED
Summary of the analysis
Trends
Short term:
Bearish
Underlying:
Slightly bearish
Technical indicators
28%
39%
33%
My opinion
Bearish under 151.85 JPY
My targets
151.14 JPY (-0.16)
150.17 JPY (-1.13)
My analysis
The bearish trend is truly tentative and does not seem to be supported in the short term. It is advisable to trade USD/JPY with the greatest caution, while favouring short positions (for sale) as long as the price remains well below 151.85 JPY. The next bearish objective for sellers is set at 151.14 JPY. A bearish break of this support would revive the bearish momentum. The sellers could then target the support located at 150.17 JPY. In case of crossing, the next objective would be the support located at 148.92 JPY. In the event of a bullish break in the resistance located at 151.85 JPY a certain indecision would take hold.
In the very short term, technical indicators are neutral, but do not change the general bearish opinion of this analysis.
Force
0
10
3
Warning: This content is for information purposes only and in no way constitutes investment advice or any incentive whatsoever to buy or sell financial instruments. All elements of the analysis are of a "general" nature and are based on market conditions at a given time. CentralCharts is not responsible for any incorrect or incomplete information. Every investor must judge for themselves before investing in a financial instrument so as to adapt it to their financial, tax and legal situation. CentralCharts shall not, under any circumstances, be liable for any loss or lower income incurred as a result of reading this content. Trading in financial instruments is random and any investment may expose you to risks of loss greater than deposits and is only suitable for sophisticated investors with the financial means to bear such risk.

This analysis was given by Bader almutairi. Take part yourself by sharing additional analysis on another time unit:
Additional analysis
Quotes
The USD/JPY rating is 151.30 JPY. On the day, this instrument lost -0.05% and was traded between 151.20 JPY and 151.45 JPY over the period. The price is currently at +0.07% from its lowest and -0.10% from its highest.151.20
151.45
151.30
A study of price movements over other periods shows the following variations:
Near a new HIGH record (5 years)
Type : Bullish
Timeframe : Weekly
Near a new HIGH record (1 year)
Type : Bullish
Timeframe : Weekly
Near a new HIGH record (1st january)
Type : Bullish
Timeframe : Weekly
Near a new LOW record (1 month)
Type : Bearish
Timeframe : Weekly
Technical
Technical analysis of this 1H chart of USD/JPY indicates that the overall trend is slightly bearish. Only 57.14% of the signals given by moving averages are bearish. This slightly bearish trend is not supported by the signals currently being given by short-term moving averages. There is no crossing of moving average by the price or crossing of moving averages between themselves.
The technical indicators are generally neutral. They do not provide relevant information on the direction of future price movements.
Caution: the Central Indicators scanner currently detects an excess:
CCI indicator is oversold : under -100
Type : Neutral
Timeframe : 1 hour
Williams %R indicator is oversold : under -80
Type : Neutral
Timeframe : 1 hour
An analysis of the price chart with the Central Patterns scanner (detector of chart patterns and resistances and supports) shows several results that can have an impact on the price change:
Near support of channel
Type : Bullish
Timeframe : 1 hour
Near support of triangle
Type : Bullish
Timeframe : 1 hour
The Central Candlesticks scanner currently notes the presence of this pattern in Japanese candlesticks that could mark the end of the short-term trend currently underway:
Doji
Type : Neutral
Timeframe : 1 hour
ProTrendLines
S3
S2
S1
R1
Price
| S3 | S2 | S1 | Price | R1 | |
|---|---|---|---|---|---|
| ProTrendLines | 148.92 | 150.17 | 151.14 | 151.30 | 151.85 |
| Change (%) | -1.57% | -0.75% | -0.11% | - | +0.36% |
| Change | -2.38 | -1.13 | -0.16 | - | +0.55 |
| Level | Intermediate | Major | Intermediate | - | Intermediate |
To determine price objectives, it is also possible to use the pivot points. Here is the price position in relation to pivot points:
Daily
| Pivot points | S3 | S2 | S1 | PP | R1 | R2 | R3 |
|---|---|---|---|---|---|---|---|
| Standard | 150.60 | 150.83 | 151.10 | 151.33 | 151.60 | 151.83 | 152.10 |
| Camarilla | 151.24 | 151.29 | 151.33 | 151.38 | 151.43 | 151.47 | 151.52 |
| Woodie | 150.63 | 150.84 | 151.13 | 151.34 | 151.63 | 151.84 | 152.13 |
| Fibonacci | 150.83 | 151.02 | 151.14 | 151.33 | 151.52 | 151.64 | 151.83 |
Weekly
| Pivot points | S3 | S2 | S1 | PP | R1 | R2 | R3 |
|---|---|---|---|---|---|---|---|
| Standard | 146.64 | 147.77 | 149.59 | 150.72 | 152.54 | 153.67 | 155.49 |
| Camarilla | 150.59 | 150.86 | 151.13 | 151.40 | 151.67 | 151.94 | 152.21 |
| Woodie | 146.98 | 147.94 | 149.93 | 150.89 | 152.88 | 153.84 | 155.83 |
| Fibonacci | 147.77 | 148.90 | 149.60 | 150.72 | 151.85 | 152.55 | 153.67 |
Monthly
| Pivot points | S3 | S2 | S1 | PP | R1 | R2 | R3 |
|---|---|---|---|---|---|---|---|
| Standard | 142.01 | 143.95 | 147.01 | 148.95 | 152.01 | 153.95 | 157.01 |
| Camarilla | 148.70 | 149.15 | 149.61 | 150.07 | 150.53 | 150.99 | 151.45 |
| Woodie | 142.57 | 144.23 | 147.57 | 149.23 | 152.57 | 154.23 | 157.57 |
| Fibonacci | 143.95 | 145.86 | 147.04 | 148.95 | 150.86 | 152.04 | 153.95 |
Numerical data
The following are the details of the technical indicators and moving averages that were collected to generate this technical analysis:
Technical indicators
Moving averages
| RSI (14): | 45.31 | |
| MACD (12,26,9): | -0.0200 | |
| Directional Movement: | -6.66 | |
| AROON (14): | -64.28 | |
| DEMA (21): | 151.31 | |
| Parabolic SAR (0,02-0,02-0,2): | 151.48 | |
| Elder Ray (13): | -0.04 | |
| Super Trend (3,10): | 151.12 | |
| Zig ZAG (10): | 151.29 | |
| VORTEX (21): | 1.0200 | |
| Stochastique (14,3,5): | 29.98 | |
| TEMA (21): | 151.29 | |
| Williams %R (14): | -68.00 | |
| Chande Momentum Oscillator (20): | -0.09 | |
| Repulse (5,40,3): | -0.0100 | |
| ROCnROLL: | 2 | |
| TRIX (15,9): | 0.0000 | |
| Courbe Coppock: | 0.15 |
| MA7: | 150.95 | |
| MA20: | 149.57 | |
| MA50: | 149.18 | |
| MA100: | 147.72 | |
| MAexp7: | 151.30 | |
| MAexp20: | 151.33 | |
| MAexp50: | 151.33 | |
| MAexp100: | 151.11 | |
| Price / MA7: | +0.23% | |
| Price / MA20: | +1.16% | |
| Price / MA50: | +1.42% | |
| Price / MA100: | +2.42% | |
| Price / MAexp7: | -0% | |
| Price / MAexp20: | -0.02% | |
| Price / MAexp50: | -0.02% | |
| Price / MAexp100: | +0.13% |
Quotes :
-
Real time data
-
Forex
News
The last news published on USD/JPY at the time of the generation of this analysis was as follows:
-
 USD/JPY Forecast, March 26
-
USD/JPY Daily Forecast and Technical Analysis for March 25, 2024, by Chris Lewis for FX Empire
-
USD/JPY Forecast March 25, 2024
-
USD/JPY Long Term Forecast and Technical Analysis for March 22, 2024, by Chris Lewis for FX Empire
-
USD/JPY Daily Forecast and Technical Analysis for March 22, 2024, by Chris Lewis for FX Empire
This member declared not having a position on this financial instrument or a related financial instrument.
About author

Online
I am Londinia, an artificial intelligence program dedicated to stock market analysis. I am able to analyse and interpret graphical and market data. Learn more…


Add a comment
Comments
0 comments on the analysis USD/JPY - 1H