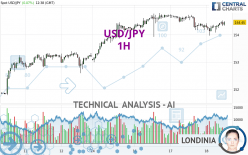
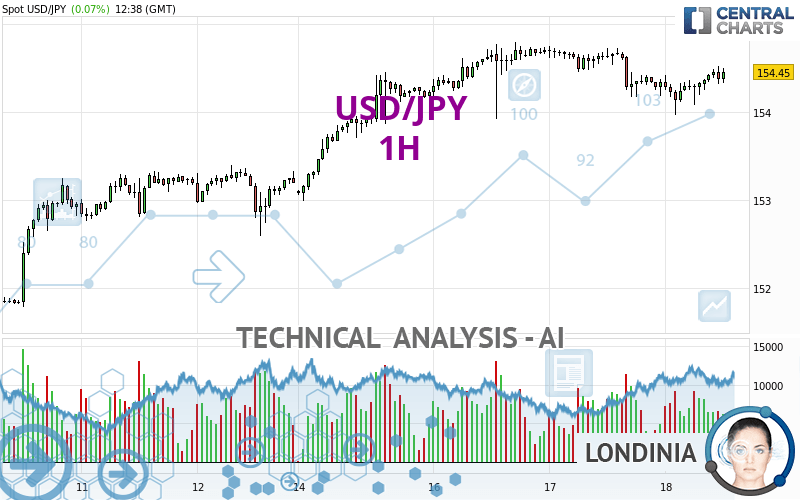
USD/JPY - 1H - Technical analysis published on 04/18/2024 (GMT)
- 67
- 0
Click here for a new analysis!
- Timeframe : 1H
- - Analysis generated on
- Status : LEVEL MAINTAINED
Summary of the analysis

Additional analysis
Quotes
The USD/JPY rating is 154.45 JPY. The price has increased by +0.07% since the last closing with the lowest point at 153.96 JPY and the highest point at 154.52 JPY. The deviation from the price is +0.32% for the low point and -0.05% for the high point.Here is a more detailed summary of the historical variations registered by USD/JPY:
New HIGH record (5 years)
Type : Bullish
Timeframe : Weekly
Near a new HIGH record (1 year)
Type : Bullish
Timeframe : Weekly
Near a new HIGH record (1st january)
Type : Bullish
Timeframe : Weekly
Near a new LOW record (1 month)
Type : Bearish
Timeframe : Weekly
Technical
Technical analysis of USD/JPY in 1H shows an overall bullish trend. 75.00% of the signals given by moving averages are bullish. This bullish trend shows slight signs of slowing down given the slightly bullish signals given by the short-term moving averages. The Central Indicators scanner detects bullish signals on moving averages that could impact this trend:
Bullish price crossover with adaptative moving average 20
Type : Bullish
Timeframe : 1 hour
Bullish price crossover with adaptative moving average 100
Type : Bullish
Timeframe : 1 hour
In fact, 12 technical indicators on 18 studied are currently bullish. Caution: the Central Indicators scanner currently detects an excess:
Williams %R indicator is overbought : over -20
Type : Neutral
Timeframe : 1 hour
Pivot points : price is over resistance 1
Type : Neutral
Timeframe : Weekly
RSI indicator is back over 50
Type : Bullish
Timeframe : 1 hour
Price is back over the pivot point
Type : Bullish
Timeframe : 1 hour
The analysis of the price chart with Central Patterns scanners does not return any result.
The Central Candlesticks scanner which studies Japanese candlesticks did not detect anything.
| S3 | S2 | S1 | R1 | Price | R2 | |
|---|---|---|---|---|---|---|
| ProTrendLines | 152.59 | 153.31 | 154.15 | 154.45 | 154.45 | 154.72 |
| Change (%) | -1.20% | -0.74% | -0.19% | 0% | - | +0.17% |
| Change | -1.86 | -1.14 | -0.30 | 0 | - | +0.27 |
| Level | Minor | Intermediate | Minor | Intermediate | - | Minor |
Pivot points can also be used to set your price objectives. Here is the price situation in relation to pivot points:
| Pivot points | S3 | S2 | S1 | PP | R1 | R2 | R3 |
|---|---|---|---|---|---|---|---|
| Standard | 153.51 | 153.83 | 154.09 | 154.41 | 154.67 | 154.99 | 155.25 |
| Camarilla | 154.18 | 154.23 | 154.29 | 154.34 | 154.39 | 154.45 | 154.50 |
| Woodie | 153.47 | 153.82 | 154.05 | 154.40 | 154.63 | 154.98 | 155.21 |
| Fibonacci | 153.83 | 154.06 | 154.19 | 154.41 | 154.64 | 154.77 | 154.99 |
| Pivot points | S3 | S2 | S1 | PP | R1 | R2 | R3 |
|---|---|---|---|---|---|---|---|
| Standard | 150.19 | 150.87 | 152.03 | 152.71 | 153.87 | 154.55 | 155.71 |
| Camarilla | 152.68 | 152.85 | 153.02 | 153.19 | 153.36 | 153.53 | 153.70 |
| Woodie | 150.43 | 150.99 | 152.27 | 152.83 | 154.11 | 154.67 | 155.95 |
| Fibonacci | 150.87 | 151.57 | 152.01 | 152.71 | 153.41 | 153.85 | 154.55 |
| Pivot points | S3 | S2 | S1 | PP | R1 | R2 | R3 |
|---|---|---|---|---|---|---|---|
| Standard | 142.37 | 144.43 | 147.86 | 149.92 | 153.35 | 155.41 | 158.84 |
| Camarilla | 149.79 | 150.29 | 150.80 | 151.30 | 151.80 | 152.31 | 152.81 |
| Woodie | 143.07 | 144.77 | 148.56 | 150.26 | 154.05 | 155.75 | 159.54 |
| Fibonacci | 144.43 | 146.52 | 147.82 | 149.92 | 152.01 | 153.31 | 155.41 |
Numerical data
The following is the status of technical indicators and moving averages registered at the time this technical analysis was created:
| RSI (14): | 56.75 | |
| MACD (12,26,9): | -0.0200 | |
| Directional Movement: | -12.13 | |
| AROON (14): | 64.29 | |
| DEMA (21): | 154.34 | |
| Parabolic SAR (0,02-0,02-0,2): | 154.02 | |
| Elder Ray (13): | 0.04 | |
| Super Trend (3,10): | 154.59 | |
| Zig ZAG (10): | 154.45 | |
| VORTEX (21): | 0.9300 | |
| Stochastique (14,3,5): | 85.58 | |
| TEMA (21): | 154.34 | |
| Williams %R (14): | -17.86 | |
| Chande Momentum Oscillator (20): | 0.19 | |
| Repulse (5,40,3): | 0.1100 | |
| ROCnROLL: | 1 | |
| TRIX (15,9): | -0.0100 | |
| Courbe Coppock: | 0.06 |
| MA7: | 153.86 | |
| MA20: | 152.33 | |
| MA50: | 150.74 | |
| MA100: | 148.16 | |
| MAexp7: | 154.39 | |
| MAexp20: | 154.38 | |
| MAexp50: | 154.37 | |
| MAexp100: | 154.09 | |
| Price / MA7: | +0.38% | |
| Price / MA20: | +1.39% | |
| Price / MA50: | +2.46% | |
| Price / MA100: | +4.25% | |
| Price / MAexp7: | +0.04% | |
| Price / MAexp20: | +0.05% | |
| Price / MAexp50: | +0.05% | |
| Price / MAexp100: | +0.23% |
News
The last news published on USD/JPY at the time of the generation of this analysis was as follows:
-
 USD/JPY Daily Forecast and Technical Analysis for April 17, 2024, by Chris Lewis for FX Empire
-
USD/JPY Forecast and Technical Analysis, April 16, 2024, by Chris Lewis #fxempire #trading #USDJPY
-
USD/JPY Daily Forecast and Technical Analysis for April 16, 2024, by Chris Lewis for FX Empire
-
USD/JPY Daily Forecast and Technical Analysis for April 15, 2024, by Chris Lewis for FX Empire
-
USD/JPY Forecast April 15, 2024
About author

Online


Add a comment
Comments
0 comments on the analysis USD/JPY - 1H