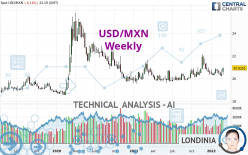
USD/MXN - Weekly - Technical analysis published on 03/06/2022 (GMT)
- 142
- 0
Click here for a new analysis!
- Timeframe : Weekly
- - Analysis generated on
- Status : INVALID

Summary of the analysis

Additional analysis
Quotes
The USD/MXN price is 20.9246 MXN. Over 5 days, this instrument gained +2.82% with the lowest point at 20.5787 MXN and the highest point at 20.9715 MXN. The deviation from the price is +1.68% for the low point and -0.22% for the high point.The Central Gaps scanner detects a bullish opening marking the presence of buyers ahead of sellers at the opening but not sufficiently marked to allow the price to register a quotation gap.
Bullish opening
Type : Bullish
Timeframe : Openning
Here is a more detailed summary of the historical variations registered by USD/MXN:
New HIGH record (1st january)
Type : Bullish
Timeframe : Weekly
New HIGH record (1 month)
Type : Bullish
Timeframe : Weekly
Technical
Technical analysis of this Weekly chart of USD/MXN indicates that the overall trend is bullish. 75.00% of the signals given by moving averages are bullish. This bullish trend is supported by the strong bullish signals given by short-term moving averages. The Central Indicators market scanner is currently detecting several bullish signals that could impact this trend:
Bullish price crossover with Moving Average 20
Type : Bullish
Timeframe : Weekly
Bullish price crossover with Moving Average 100
Type : Bullish
Timeframe : Weekly
Bullish price crossover with adaptative moving average 20
Type : Bullish
Timeframe : Weekly
Bullish price crossover with adaptative moving average 50
Type : Bullish
Timeframe : Weekly
Bullish price crossover with adaptative moving average 100
Type : Bullish
Timeframe : Weekly
The technical indicators are generally neutral. They do not provide relevant information on the direction of future price movements.
Central Indicators, the detector scanner for these technical indicators has recently detected several signals:
Pivot points : price is over resistance 1
Type : Neutral
Timeframe : Weekly
RSI indicator is back over 50
Type : Bullish
Timeframe : Weekly
Momentum indicator is back over 0
Type : Bullish
Timeframe : Weekly
An analysis of the price chart with the Central Patterns scanner (detector of chart patterns and resistances and supports) shows a result that can have an impact on the price change:
Near resistance of channel
Type : Bearish
Timeframe : Weekly
The Central Candlesticks scanner which studies Japanese candlesticks did not detect anything.
| S3 | S2 | S1 | Price | R1 | R2 | R3 | |
|---|---|---|---|---|---|---|---|
| ProTrendLines | 18.5173 | 19.6110 | 20.1580 | 20.9246 | 21.9263 | 23.0583 | 25.3263 |
| Change (%) | -11.50% | -6.28% | -3.66% | - | +4.79% | +10.20% | +21.04% |
| Change | -2.4073 | -1.3136 | -0.7666 | - | +1.0017 | +2.1337 | +4.4017 |
| Level | Intermediate | Major | Major | - | Major | Minor | Major |
To determine price objectives, it is also possible to use the pivot points. Here is the price position in relation to pivot points:
| Pivot points | S3 | S2 | S1 | PP | R1 | R2 | R3 |
|---|---|---|---|---|---|---|---|
| Standard | 20.4129 | 20.5278 | 20.7416 | 20.8565 | 21.0703 | 21.1852 | 21.3990 |
| Camarilla | 20.8649 | 20.8950 | 20.9252 | 20.9553 | 20.9854 | 21.0156 | 21.0457 |
| Woodie | 20.4623 | 20.5525 | 20.7910 | 20.8812 | 21.1197 | 21.2099 | 21.4484 |
| Fibonacci | 20.5278 | 20.6534 | 20.7310 | 20.8565 | 20.9821 | 21.0597 | 21.1852 |
| Pivot points | S3 | S2 | S1 | PP | R1 | R2 | R3 |
|---|---|---|---|---|---|---|---|
| Standard | 19.8727 | 20.0957 | 20.5255 | 20.7485 | 21.1783 | 21.4013 | 21.8311 |
| Camarilla | 20.7758 | 20.8356 | 20.8955 | 20.9553 | 21.0151 | 21.0750 | 21.1348 |
| Woodie | 19.9761 | 20.1474 | 20.6289 | 20.8002 | 21.2817 | 21.4530 | 21.9345 |
| Fibonacci | 20.0957 | 20.3451 | 20.4991 | 20.7485 | 20.9979 | 21.1519 | 21.4013 |
| Pivot points | S3 | S2 | S1 | PP | R1 | R2 | R3 |
|---|---|---|---|---|---|---|---|
| Standard | 19.5288 | 19.8430 | 20.1613 | 20.4755 | 20.7938 | 21.1080 | 21.4263 |
| Camarilla | 20.3058 | 20.3637 | 20.4217 | 20.4797 | 20.5377 | 20.5957 | 20.6536 |
| Woodie | 19.5310 | 19.8440 | 20.1635 | 20.4765 | 20.7960 | 21.1090 | 21.4285 |
| Fibonacci | 19.8430 | 20.0846 | 20.2339 | 20.4755 | 20.7171 | 20.8664 | 21.1080 |
Numerical data
The following is the status of the technical indicators and moving averages at the time of publication of this technical analysis:
| RSI (14): | 56.25 | |
| MACD (12,26,9): | 0.0582 | |
| Directional Movement: | 12.4938 | |
| AROON (14): | -92.8571 | |
| DEMA (21): | 20.6608 | |
| Parabolic SAR (0,02-0,02-0,2): | 20.9804 | |
| Elder Ray (13): | 0.0496 | |
| Super Trend (3,10): | 19.8587 | |
| Zig ZAG (10): | 20.9553 | |
| VORTEX (21): | 0.9931 | |
| Stochastique (14,3,5): | 18.72 | |
| TEMA (21): | 20.6637 | |
| Williams %R (14): | -56.55 | |
| Chande Momentum Oscillator (20): | 0.0731 | |
| Repulse (5,40,3): | 2.0272 | |
| ROCnROLL: | 1 | |
| TRIX (15,9): | 0.0694 | |
| Courbe Coppock: | 2.55 |
| MA7: | 20.6134 | |
| MA20: | 20.4832 | |
| MA50: | 20.5129 | |
| MA100: | 20.6575 | |
| MAexp7: | 20.6031 | |
| MAexp20: | 20.5676 | |
| MAexp50: | 20.4976 | |
| MAexp100: | 20.4477 | |
| Price / MA7: | +1.51% | |
| Price / MA20: | +2.15% | |
| Price / MA50: | +2.01% | |
| Price / MA100: | +1.29% | |
| Price / MAexp7: | +1.56% | |
| Price / MAexp20: | +1.74% | |
| Price / MAexp50: | +2.09% | |
| Price / MAexp100: | +2.33% |
News
Don't forget to follow the news on USD/MXN. At the time of publication of this analysis, the latest news was as follows:
-
 USD/ZAR and USD/MXN Forecast February 23, 2022
-
USD/MXN Forecast January 13, 2022
-
USD/ZAR and USD/MXN Forecast January 3, 2022
-
USD/ZAR and USD/MXN Forecast November 24, 2021
-
USD/MXN Forecast June 11, 2021
About author

Online


Add a comment
Comments
0 comments on the analysis USD/MXN - Weekly