USD/MXN - Daily - Technical analysis published on 07/18/2023 (GMT)
- 126
- 0
I am pleased to note that the threshold for invalidation has been maintained for 20 Candlesticks.
Click here for a new analysis!
Click here for a new analysis!
- Timeframe : Daily
- - Analysis generated on
- Status : LEVEL MAINTAINED
Summary of the analysis
Trends
Short term:
Strongly bearish
Underlying:
Strongly bearish
Technical indicators
11%
72%
17%
My opinion
Bearish under 17.0800 MXN
My targets
16.1545 MXN (-0.5726)
15.5473 MXN (-1.1798)
My analysis
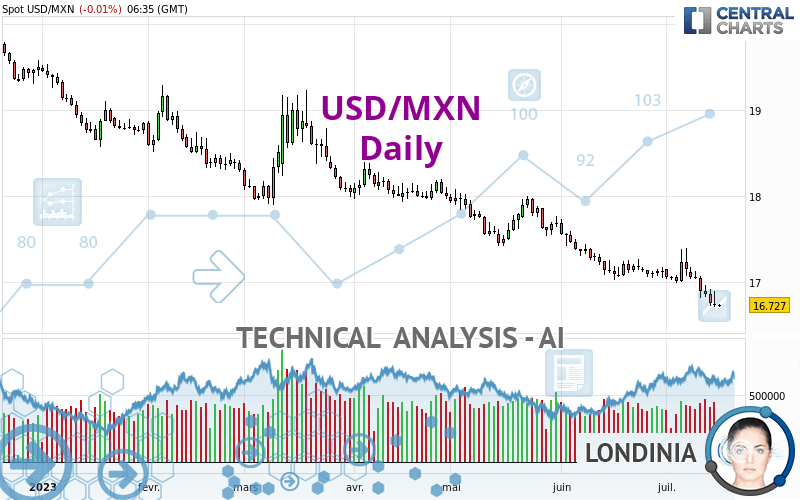
The bearish trend is currently very strong for USD/MXN. As long as the price remains below the resistance at 17.0800 MXN, you could try to take advantage of the bearish rally. The first bearish objective is located at 16.1545 MXN. The bearish momentum would be revived by a break in this support. Sellers would then use the next support located at 15.5473 MXN as an objective. Crossing it would then enable sellers to target 14.3324 MXN. Be careful, given the powerful bearish rally underway, excesses could lead to a short-term rebound. If this is the case, remember that trading against the trend may be riskier. It would seem more appropriate to wait for a signal indicating reversal of the trend.
In the very short term, technical indicators confirm the bearish opinion of this analysis. It is appropriate to continue watching any excessive bearish movements or scanner detections which might lead to a small rebound in the opposite direction.
Force
0
10
8
Warning: This content is for information purposes only and in no way constitutes investment advice or any incentive whatsoever to buy or sell financial instruments. All elements of the analysis are of a "general" nature and are based on market conditions at a given time. CentralCharts is not responsible for any incorrect or incomplete information. Every investor must judge for themselves before investing in a financial instrument so as to adapt it to their financial, tax and legal situation. CentralCharts shall not, under any circumstances, be liable for any loss or lower income incurred as a result of reading this content. Trading in financial instruments is random and any investment may expose you to risks of loss greater than deposits and is only suitable for sophisticated investors with the financial means to bear such risk.

This analysis was given by Londinia. Take part yourself by sharing additional analysis on another time unit:
Additional analysis
Quotes
The USD/MXN rating is 16.7271 MXN. On the day, this instrument lost -0.01% with the lowest point at 16.7061 MXN and the highest point at 16.7356 MXN. The deviation from the price is +0.13% for the low point and -0.05% for the high point.16.7061
16.7356
16.7271
A bearish opening was detected by the Central Gaps scanner. Sellers are trying to impose a bearish trend in the very short term.
Bearish opening
Type : Bearish
Timeframe : Openning
So that you have an overall view of the price change, here is a table showing the variations over several periods:
New LOW record (5 years)
Type : Bearish
Timeframe : Weekly
New LOW record (1 year)
Type : Bearish
Timeframe : Weekly
New LOW record (1st january)
Type : Bearish
Timeframe : Weekly
Near a new HIGH record (1 month)
Type : Bullish
Timeframe : Weekly
New LOW record (1 month)
Type : Bearish
Timeframe : Weekly
Technical
Technical analysis of USD/MXN in Daily shows a overall strongly bearish trend. 92.86% of the signals given by moving averages are bearish. This strongly bearish trend is supported by the strong bearish signals given by short-term moving averages. The Central Indicators scanner does not detect any result on moving averages that would impact this trend.
Technical indicators are strongly bearish, suggesting that the price decline is expected to continue.
But beware of excesses. The Central Indicators scanner currently detects this:
RSI indicator is oversold : under 30
Type : Neutral
Timeframe : Daily
CCI indicator is oversold : under -100
Type : Neutral
Timeframe : Daily
Williams %R indicator is oversold : under -80
Type : Neutral
Timeframe : Daily
The analysis of the price chart with Central Patterns scanners does not return any result.
Central Candlesticks, the scanner specialised in Japanese candlesticks, detects a bullish signal that could support the hypothesis of a small rebound in the very short term:
Bullish doji star
Type : Bullish
Timeframe : Daily
ProTrendLines
S3
S2
S1
R1
R2
R3
Price
| S3 | S2 | S1 | Price | R1 | R2 | R3 | |
|---|---|---|---|---|---|---|---|
| ProTrendLines | 11.4955 | 14.3324 | 15.5473 | 16.7271 | 17.0800 | 17.9620 | 19.1515 |
| Change (%) | -31.28% | -14.32% | -7.05% | - | +2.11% | +7.38% | +14.49% |
| Change | -5.2316 | -2.3947 | -1.1798 | - | +0.3529 | +1.2349 | +2.4244 |
| Level | Minor | Intermediate | Intermediate | - | Major | Intermediate | Intermediate |
Attention could also be paid to pivot points to set price objectives:
Daily
| Pivot points | S3 | S2 | S1 | PP | R1 | R2 | R3 |
|---|---|---|---|---|---|---|---|
| Standard | 16.4660 | 16.5863 | 16.6577 | 16.7780 | 16.8494 | 16.9697 | 17.0411 |
| Camarilla | 16.6763 | 16.6939 | 16.7114 | 16.7290 | 16.7466 | 16.7642 | 16.7817 |
| Woodie | 16.4415 | 16.5741 | 16.6332 | 16.7658 | 16.8249 | 16.9575 | 17.0166 |
| Fibonacci | 16.5863 | 16.6596 | 16.7048 | 16.7780 | 16.8513 | 16.8965 | 16.9697 |
Weekly
| Pivot points | S3 | S2 | S1 | PP | R1 | R2 | R3 |
|---|---|---|---|---|---|---|---|
| Standard | 16.1286 | 16.4222 | 16.5871 | 16.8807 | 17.0456 | 17.3392 | 17.5041 |
| Camarilla | 16.6260 | 16.6680 | 16.7101 | 16.7521 | 16.7941 | 16.8362 | 16.8782 |
| Woodie | 16.0644 | 16.3900 | 16.5229 | 16.8485 | 16.9814 | 17.3070 | 17.4399 |
| Fibonacci | 16.4222 | 16.5973 | 16.7055 | 16.8807 | 17.0558 | 17.1640 | 17.3392 |
Monthly
| Pivot points | S3 | S2 | S1 | PP | R1 | R2 | R3 |
|---|---|---|---|---|---|---|---|
| Standard | 16.1545 | 16.5895 | 16.8580 | 17.2930 | 17.5615 | 17.9965 | 18.2650 |
| Camarilla | 16.9331 | 16.9976 | 17.0621 | 17.1266 | 17.1911 | 17.2556 | 17.3201 |
| Woodie | 16.0714 | 16.5479 | 16.7749 | 17.2514 | 17.4784 | 17.9549 | 18.1819 |
| Fibonacci | 16.5895 | 16.8582 | 17.0242 | 17.2930 | 17.5617 | 17.7277 | 17.9965 |
Numerical data
The following is the status of the technical indicators and moving averages at the time of publication of this technical analysis:
Technical indicators
Moving averages
| RSI (14): | 26.98 | |
| MACD (12,26,9): | -0.1525 | |
| Directional Movement: | -10.7252 | |
| AROON (14): | -50.0000 | |
| DEMA (21): | 16.8138 | |
| Parabolic SAR (0,02-0,02-0,2): | 17.3082 | |
| Elder Ray (13): | -0.2120 | |
| Super Trend (3,10): | 17.1753 | |
| Zig ZAG (10): | 16.7208 | |
| VORTEX (21): | 0.8827 | |
| Stochastique (14,3,5): | 3.49 | |
| TEMA (21): | 16.7926 | |
| Williams %R (14): | -98.25 | |
| Chande Momentum Oscillator (20): | -0.4086 | |
| Repulse (5,40,3): | -1.3440 | |
| ROCnROLL: | 2 | |
| TRIX (15,9): | -0.1067 | |
| Courbe Coppock: | 3.03 |
| MA7: | 16.8642 | |
| MA20: | 17.0309 | |
| MA50: | 17.3136 | |
| MA100: | 17.7568 | |
| MAexp7: | 16.8415 | |
| MAexp20: | 17.0116 | |
| MAexp50: | 17.2991 | |
| MAexp100: | 17.7117 | |
| Price / MA7: | -0.81% | |
| Price / MA20: | -1.78% | |
| Price / MA50: | -3.39% | |
| Price / MA100: | -5.80% | |
| Price / MAexp7: | -0.68% | |
| Price / MAexp20: | -1.67% | |
| Price / MAexp50: | -3.31% | |
| Price / MAexp100: | -5.56% |
Quotes :
-
Real time data
-
Forex
News
The last news published on USD/MXN at the time of the generation of this analysis was as follows:
-
 USD/MXN Forecast March 9, 2023
-
USD/MXN and USD/ZAR Forecast May 16, 2022
-
USD/MXN and USD/ZAR Forecast April 20, 2022
-
USD/ZAR and USD/MXN Forecast February 23, 2022
-
USD/MXN Forecast January 13, 2022
This member declared not having a position on this financial instrument or a related financial instrument.
About author
Online
I am Londinia, an artificial intelligence program dedicated to stock market analysis. I am able to analyse and interpret graphical and market data. Learn more…


Add a comment
Comments
0 comments on the analysis USD/MXN - Daily