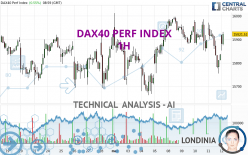
DAX40 PERF INDEX - 1H - Technical analysis published on 05/12/2023 (GMT)
- Who voted?
- 105
- 0
Click here for a new analysis!
- Timeframe : 1H
- - Analysis generated on
- Status : LEVEL MAINTAINED

Summary of the analysis

Additional analysis
Quotes
The DAX40 PERF INDEX rating is 15,921.46 EUR. On the day, this instrument gained +0.55% and was between 15,852.10 EUR and 15,931.36 EUR. This implies that the price is at +0.44% from its lowest and at -0.06% from its highest.The Central Gaps scanner detects a bullish opening marking the presence of buyers ahead of sellers at the opening but not sufficiently marked to allow the price to register a quotation gap.
Bullish opening
Type : Bullish
Timeframe : Openning
So that you have an overall view of the price change, here is a table showing the variations over several periods:
Near a new HIGH record (5 years)
Type : Bullish
Timeframe : Weekly
Near a new HIGH record (1 year)
Type : Bullish
Timeframe : Weekly
Near a new HIGH record (1st january)
Type : Bullish
Timeframe : Weekly
Near a new LOW record (1 month)
Type : Bearish
Timeframe : Weekly
Technical
Technical analysis of this 1H chart of DAX40 PERF INDEX indicates that the overall trend is strongly bullish. 85.71% of the signals given by moving averages are bullish. The slightly bullish signals given by the short-term moving averages indicate this trend is showing signs of running out of steam. The Central Indicators scanner detects bullish signals on moving averages that could impact this trend:
Bullish trend reversal : Moving Average 100
Type : Bullish
Timeframe : 1 hour
Bullish trend reversal : adaptative moving average 20
Type : Bullish
Timeframe : 1 hour
Bullish trend reversal : adaptative moving average 50
Type : Bullish
Timeframe : 1 hour
Bullish trend reversal : adaptative moving average 100
Type : Bullish
Timeframe : 1 hour
Bullish price crossover with Moving Average 20
Type : Bullish
Timeframe : 1 hour
Bullish price crossover with Moving Average 50
Type : Bullish
Timeframe : 1 hour
Bullish price crossover with adaptative moving average 20
Type : Bullish
Timeframe : 1 hour
In fact, 11 technical indicators on 18 studied are currently bullish. Central Indicators, the scanner specialised in technical indicators, has identified these signals:
RSI indicator is back over 50
Type : Bullish
Timeframe : 1 hour
Ichimoku : price is over the cloud
Type : Bullish
Timeframe : 1 hour
Momentum indicator is back over 0
Type : Bullish
Timeframe : 1 hour
Central Patterns, the scanner specializing in chart patterns, did not identify any signals.
The Central Candlesticks scanner which studies Japanese candlesticks did not detect anything.
| S3 | S2 | S1 | Price | R1 | R2 | |
|---|---|---|---|---|---|---|
| ProTrendLines | 15,764.40 | 15,828.00 | 15,917.90 | 15,921.46 | 15,984.00 | 16,271.80 |
| Change (%) | -0.99% | -0.59% | -0.02% | - | +0.39% | +2.20% |
| Change | -157.06 | -93.46 | -3.56 | - | +62.54 | +350.34 |
| Level | Minor | Minor | Intermediate | - | Minor | Major |
Pivot points can also be used to set your price objectives. Here is the price situation in relation to pivot points:
| Pivot points | S3 | S2 | S1 | PP | R1 | R2 | R3 |
|---|---|---|---|---|---|---|---|
| Standard | 15,520.49 | 15,637.62 | 15,736.27 | 15,853.40 | 15,952.05 | 16,069.18 | 16,167.83 |
| Camarilla | 15,775.57 | 15,795.35 | 15,815.13 | 15,834.91 | 15,854.69 | 15,874.47 | 15,894.25 |
| Woodie | 15,511.24 | 15,633.00 | 15,727.02 | 15,848.78 | 15,942.80 | 16,064.56 | 16,158.58 |
| Fibonacci | 15,637.62 | 15,720.05 | 15,770.98 | 15,853.40 | 15,935.83 | 15,986.76 | 16,069.18 |
| Pivot points | S3 | S2 | S1 | PP | R1 | R2 | R3 |
|---|---|---|---|---|---|---|---|
| Standard | 15,395.80 | 15,529.06 | 15,745.04 | 15,878.30 | 16,094.28 | 16,227.54 | 16,443.52 |
| Camarilla | 15,864.98 | 15,896.99 | 15,929.01 | 15,961.02 | 15,993.03 | 16,025.05 | 16,057.06 |
| Woodie | 15,437.16 | 15,549.74 | 15,786.40 | 15,898.98 | 16,135.64 | 16,248.22 | 16,484.88 |
| Fibonacci | 15,529.06 | 15,662.47 | 15,744.89 | 15,878.30 | 16,011.71 | 16,094.13 | 16,227.54 |
| Pivot points | S3 | S2 | S1 | PP | R1 | R2 | R3 |
|---|---|---|---|---|---|---|---|
| Standard | 15,189.88 | 15,336.38 | 15,629.38 | 15,775.88 | 16,068.88 | 16,215.38 | 16,508.38 |
| Camarilla | 15,801.52 | 15,841.81 | 15,882.09 | 15,922.38 | 15,962.67 | 16,002.96 | 16,043.24 |
| Woodie | 15,263.13 | 15,373.01 | 15,702.63 | 15,812.51 | 16,142.13 | 16,252.01 | 16,581.63 |
| Fibonacci | 15,336.38 | 15,504.27 | 15,607.99 | 15,775.88 | 15,943.77 | 16,047.49 | 16,215.38 |
Numerical data
The following are the details of the technical indicators and moving averages that were collected to generate this technical analysis:
| RSI (14): | 54.75 | |
| MACD (12,26,9): | -11.4900 | |
| Directional Movement: | 1.83 | |
| AROON (14): | -71.43 | |
| DEMA (21): | 15,869.95 | |
| Parabolic SAR (0,02-0,02-0,2): | 15,758.09 | |
| Elder Ray (13): | 27.95 | |
| Super Trend (3,10): | 15,933.77 | |
| Zig ZAG (10): | 15,917.70 | |
| VORTEX (21): | 0.9400 | |
| Stochastique (14,3,5): | 53.61 | |
| TEMA (21): | 15,852.35 | |
| Williams %R (14): | -28.89 | |
| Chande Momentum Oscillator (20): | 56.80 | |
| Repulse (5,40,3): | 0.1800 | |
| ROCnROLL: | 1 | |
| TRIX (15,9): | -0.0100 | |
| Courbe Coppock: | 0.69 |
| MA7: | 15,893.64 | |
| MA20: | 15,855.58 | |
| MA50: | 15,550.87 | |
| MA100: | 15,251.01 | |
| MAexp7: | 15,870.22 | |
| MAexp20: | 15,883.20 | |
| MAexp50: | 15,882.03 | |
| MAexp100: | 15,857.34 | |
| Price / MA7: | +0.18% | |
| Price / MA20: | +0.42% | |
| Price / MA50: | +2.38% | |
| Price / MA100: | +4.40% | |
| Price / MAexp7: | +0.32% | |
| Price / MAexp20: | +0.24% | |
| Price / MAexp50: | +0.25% | |
| Price / MAexp100: | +0.40% |
News
The latest news and videos published on DAX40 PERF INDEX at the time of the analysis were as follows:
-
 Could the ECB shock the market? German DAX in focus.
-
DAX Forecast March 23, 2023
-
Trade of the Week: Long DAX 40
-
US growth stocks come into view as Dax weakens
-
DAX Forecast February 28, 2023
About author

Online


Add a comment
Comments
0 comments on the analysis DAX40 PERF INDEX - 1H