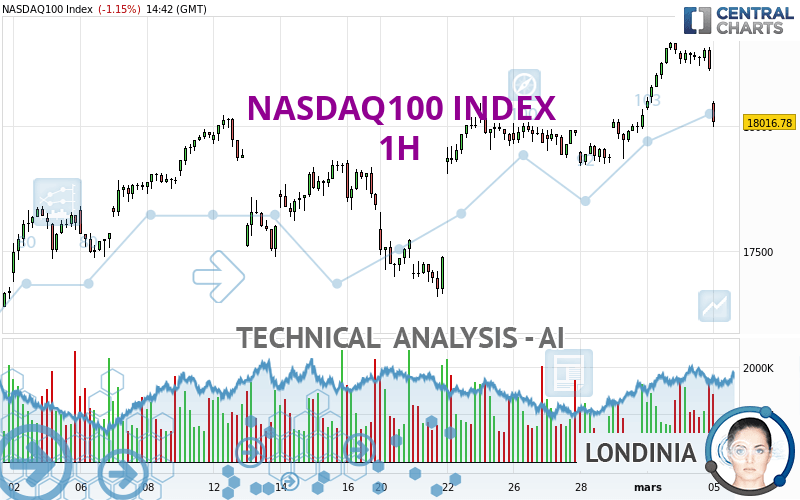
NASDAQ100 INDEX - 1H - Technical analysis published on 03/05/2024 (GMT)
- 122
- 0
- Timeframe : 1H
- - Analysis generated on
- Status : NEUTRAL

Summary of the analysis

Additional analysis
Quotes
The NASDAQ100 INDEX price is 18,039.91 USD. The price is lower by -1.02% since the last closing with the lowest point at 18,032.90 USD and the highest point at 18,097.50 USD. The deviation from the price is +0.04% for the low point and -0.32% for the high point.A bearish gap was detected at the opening by the Central Gaps scanner. There are a lot of sellers and they have the upper hand in the very short term.
Opening Gap DOWN
Type : Bearish
Timeframe : Openning
So that you have an overall view of the price change, here is a table showing the variations over several periods:
Near a new HIGH record (5 years)
Type : Bullish
Timeframe : Weekly
Technical
Technical analysis of NASDAQ100 INDEX in 1H shows an overall slightly bullish trend. 60.71% of the signals given by moving averages are bullish. Caution: the slightly bearish signals currently given by short-term moving averages indicate that the overall trend could be reversed. The Central Indicators scanner detects bearish signals on moving averages that could impact this trend:
Bearish price crossover with Moving Average 20
Type : Bearish
Timeframe : 1 hour
Bearish price crossover with adaptative moving average 20
Type : Bearish
Timeframe : 1 hour
Bearish price crossover with adaptative moving average 50
Type : Bearish
Timeframe : 1 hour
An assessment of technical indicators does not currently provide any relevant information to suggest whether the signal given by the technical indicators is more bullish or bearish.
Caution: the Central Indicators scanner currently detects an excess:
Williams %R indicator is oversold : under -80
Type : Neutral
Timeframe : 1 hour
Pivot points : price is under support 3
Type : Neutral
Timeframe : 1 hour
RSI indicator is back under 50
Type : Bearish
Timeframe : 1 hour
SuperTrend indicator bearish reversal
Type : Bearish
Timeframe : 1 hour
Momentum indicator is back under 0
Type : Bearish
Timeframe : 1 hour
The analysis of the price chart with Central Patterns scanners does not return any result.
For a small setback in the very short term, the Central Candlesticks scanner currently notes the presence of this bearish pattern in Japanese candlesticks:
Downside gap
Type : Bearish
Timeframe : 1 hour
| S3 | S2 | S1 | Price | R1 | |
|---|---|---|---|---|---|
| ProTrendLines | 17,475.38 | 17,840.92 | 18,004.70 | 18,039.91 | 18,333.26 |
| Change (%) | -3.13% | -1.10% | -0.20% | - | +1.63% |
| Change | -564.53 | -198.99 | -35.21 | - | +293.35 |
| Level | Minor | Intermediate | Major | - | Intermediate |
Attention could also be paid to pivot points to set price objectives:
| Pivot points | S3 | S2 | S1 | PP | R1 | R2 | R3 |
|---|---|---|---|---|---|---|---|
| Standard | 18,096.83 | 18,157.54 | 18,192.01 | 18,252.72 | 18,287.19 | 18,347.90 | 18,382.37 |
| Camarilla | 18,200.31 | 18,209.03 | 18,217.76 | 18,226.48 | 18,235.21 | 18,243.93 | 18,252.66 |
| Woodie | 18,083.71 | 18,150.98 | 18,178.89 | 18,246.16 | 18,274.07 | 18,341.34 | 18,369.25 |
| Fibonacci | 18,157.54 | 18,193.90 | 18,216.36 | 18,252.72 | 18,289.08 | 18,311.54 | 18,347.90 |
| Pivot points | S3 | S2 | S1 | PP | R1 | R2 | R3 |
|---|---|---|---|---|---|---|---|
| Standard | 17,491.53 | 17,665.94 | 17,984.43 | 18,158.84 | 18,477.33 | 18,651.74 | 18,970.23 |
| Camarilla | 18,167.36 | 18,212.55 | 18,257.73 | 18,302.91 | 18,348.09 | 18,393.28 | 18,438.46 |
| Woodie | 17,563.56 | 17,701.96 | 18,056.46 | 18,194.86 | 18,549.36 | 18,687.76 | 19,042.26 |
| Fibonacci | 17,665.94 | 17,854.23 | 17,970.56 | 18,158.84 | 18,347.13 | 18,463.46 | 18,651.74 |
| Pivot points | S3 | S2 | S1 | PP | R1 | R2 | R3 |
|---|---|---|---|---|---|---|---|
| Standard | 16,533.46 | 16,854.64 | 17,449.25 | 17,770.43 | 18,365.04 | 18,686.22 | 19,280.83 |
| Camarilla | 17,792.01 | 17,875.96 | 17,959.90 | 18,043.85 | 18,127.80 | 18,211.75 | 18,295.69 |
| Woodie | 16,670.17 | 16,923.00 | 17,585.96 | 17,838.79 | 18,501.75 | 18,754.58 | 19,417.54 |
| Fibonacci | 16,854.64 | 17,204.48 | 17,420.60 | 17,770.43 | 18,120.27 | 18,336.39 | 18,686.22 |
Numerical data
The following is the status of technical indicators and moving averages registered at the time this technical analysis was created:
| RSI (14): | 41.28 | |
| MACD (12,26,9): | 63.5200 | |
| Directional Movement: | -11.73 | |
| AROON (14): | -64.29 | |
| DEMA (21): | 18,267.98 | |
| Parabolic SAR (0,02-0,02-0,2): | 18,325.08 | |
| Elder Ray (13): | -140.70 | |
| Super Trend (3,10): | 18,279.64 | |
| Zig ZAG (10): | 18,040.59 | |
| VORTEX (21): | 1.0900 | |
| Stochastique (14,3,5): | 50.96 | |
| TEMA (21): | 18,265.44 | |
| Williams %R (14): | -98.60 | |
| Chande Momentum Oscillator (20): | -162.25 | |
| Repulse (5,40,3): | -0.5800 | |
| ROCnROLL: | -1 | |
| TRIX (15,9): | 0.0700 | |
| Courbe Coppock: | 1.88 |
| MA7: | 18,056.14 | |
| MA20: | 17,863.13 | |
| MA50: | 17,348.56 | |
| MA100: | 16,439.72 | |
| MAexp7: | 18,206.79 | |
| MAexp20: | 18,173.59 | |
| MAexp50: | 18,047.97 | |
| MAexp100: | 17,910.06 | |
| Price / MA7: | -0.09% | |
| Price / MA20: | +0.99% | |
| Price / MA50: | +3.99% | |
| Price / MA100: | +9.73% | |
| Price / MAexp7: | -0.92% | |
| Price / MAexp20: | -0.74% | |
| Price / MAexp50: | -0.04% | |
| Price / MAexp100: | +0.73% |
News
The last news published on NASDAQ100 INDEX at the time of the generation of this analysis was as follows:
-
 NASDAQ 100 Daily Forecast and Technical Analysis for March 05, 2024, by Chris Lewis for FX Empire
-
NASDAQ 100 Forecast March 5, 2024
-
NASDAQ 100 Daily Forecast and Technical Analysis for March 04, 2024, by Chris Lewis for FX Empire
-
“Buzz on the Street” Show: Foremost Lithium Resource & Technology (NASDAQ: FMST) $10M Application
-
Trading the trend: long Nasdaq 100
About author

Online


Add a comment
Comments
0 comments on the analysis NASDAQ100 INDEX - 1H