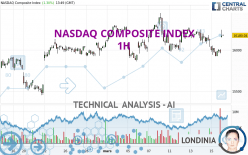
NASDAQ COMPOSITE INDEX - 1H - Technical analysis published on 03/18/2024 (GMT)
- 113
- 0
Click here for a new analysis!
- Timeframe : 1H
- - Analysis generated on
- Status : INVALID

Summary of the analysis

Additional analysis
Quotes
The NASDAQ COMPOSITE INDEX price is 16,217.78 USD. On the day, this instrument gained +1.53% and was traded between 16,154.92 USD and 16,246.65 USD over the period. The price is currently at +0.39% from its lowest and -0.18% from its highest.The Central Gaps scanner detects a bullish gap which is a sign that buyers have taken the lead in the very short term.
Opening Gap UP
Type : Bullish
Timeframe : Openning
A study of price movements over other periods shows the following variations:
Near a new HIGH record (5 years)
Type : Bullish
Timeframe : Weekly
Technical
Technical analysis of this 1H chart of NASDAQ COMPOSITE INDEX indicates that the overall trend is strongly bullish. 82.14% of the signals given by moving averages are bullish. The overall trend is supported by the strong bullish signals from short-term moving averages. The Central Indicators market scanner is currently detecting several bullish signals that could impact this trend:
Bullish price crossover with Moving Average 20
Type : Bullish
Timeframe : 1 hour
Bullish price crossover with Moving Average 50
Type : Bullish
Timeframe : 1 hour
Bullish price crossover with Moving Average 100
Type : Bullish
Timeframe : 1 hour
Bullish price crossover with adaptative moving average 20
Type : Bullish
Timeframe : 1 hour
Bullish price crossover with adaptative moving average 50
Type : Bullish
Timeframe : 1 hour
Bullish price crossover with adaptative moving average 100
Type : Bullish
Timeframe : 1 hour
In fact, 11 technical indicators on 18 studied are currently bullish. Caution: the Central Indicators scanner currently detects an excess:
Williams %R indicator is overbought : over -20
Type : Neutral
Timeframe : 1 hour
Pivot points : price is over resistance 3
Type : Neutral
Timeframe : 1 hour
RSI indicator is back over 50
Type : Bullish
Timeframe : 1 hour
MACD crosses UP its Moving Average
Type : Bullish
Timeframe : 1 hour
Parabolic SAR indicator bullish reversal
Type : Bullish
Timeframe : 1 hour
Ichimoku : price is over the cloud
Type : Bullish
Timeframe : 1 hour
SuperTrend indicator bullish reversal
Type : Bullish
Timeframe : 1 hour
Momentum indicator is back over 0
Type : Bullish
Timeframe : 1 hour
No signals are given by Central Patterns, a market scanner specialised in chart patterns, resistances and supports.
The Central Candlesticks scanner, specialised in Japanese candlesticks, did not identify any signals.
| S3 | S2 | S1 | Price | R1 | R2 | |
|---|---|---|---|---|---|---|
| ProTrendLines | 15,922.28 | 16,057.40 | 16,136.04 | 16,217.78 | 16,246.15 | 16,449.70 |
| Change (%) | -1.82% | -0.99% | -0.50% | - | +0.17% | +1.43% |
| Change | -295.50 | -160.38 | -81.74 | - | +28.37 | +231.92 |
| Level | Major | Major | Intermediate | - | Minor | Minor |
To determine price objectives, it is also possible to use the pivot points. Here is the price position in relation to pivot points:
| Pivot points | S3 | S2 | S1 | PP | R1 | R2 | R3 |
|---|---|---|---|---|---|---|---|
| Standard | 15,784.86 | 15,855.38 | 15,914.28 | 15,984.80 | 16,043.70 | 16,114.22 | 16,173.12 |
| Camarilla | 15,937.58 | 15,949.44 | 15,961.31 | 15,973.17 | 15,985.03 | 15,996.90 | 16,008.76 |
| Woodie | 15,779.04 | 15,852.48 | 15,908.46 | 15,981.90 | 16,037.88 | 16,111.32 | 16,167.30 |
| Fibonacci | 15,855.38 | 15,904.82 | 15,935.37 | 15,984.80 | 16,034.24 | 16,064.79 | 16,114.22 |
| Pivot points | S3 | S2 | S1 | PP | R1 | R2 | R3 |
|---|---|---|---|---|---|---|---|
| Standard | 15,491.36 | 15,708.64 | 15,840.90 | 16,058.18 | 16,190.44 | 16,407.72 | 16,539.98 |
| Camarilla | 15,877.05 | 15,909.09 | 15,941.13 | 15,973.17 | 16,005.21 | 16,037.25 | 16,069.29 |
| Woodie | 15,448.86 | 15,687.39 | 15,798.40 | 16,036.93 | 16,147.94 | 16,386.47 | 16,497.48 |
| Fibonacci | 15,708.64 | 15,842.16 | 15,924.65 | 16,058.18 | 16,191.70 | 16,274.19 | 16,407.72 |
| Pivot points | S3 | S2 | S1 | PP | R1 | R2 | R3 |
|---|---|---|---|---|---|---|---|
| Standard | 14,563.79 | 14,886.33 | 15,489.13 | 15,811.67 | 16,414.47 | 16,737.01 | 17,339.81 |
| Camarilla | 15,837.45 | 15,922.27 | 16,007.10 | 16,091.92 | 16,176.74 | 16,261.57 | 16,346.39 |
| Woodie | 14,703.91 | 14,956.40 | 15,629.25 | 15,881.74 | 16,554.59 | 16,807.08 | 17,479.93 |
| Fibonacci | 14,886.33 | 15,239.81 | 15,458.19 | 15,811.67 | 16,165.15 | 16,383.53 | 16,737.01 |
Numerical data
The following is the status of the technical indicators and moving averages at the time of publication of this technical analysis:
| RSI (14): | 58.57 | |
| MACD (12,26,9): | -30.4700 | |
| Directional Movement: | 4.21 | |
| AROON (14): | -71.43 | |
| DEMA (21): | 16,044.44 | |
| Parabolic SAR (0,02-0,02-0,2): | 15,925.91 | |
| Elder Ray (13): | 125.26 | |
| Super Trend (3,10): | 15,916.56 | |
| Zig ZAG (10): | 16,222.98 | |
| VORTEX (21): | 0.8400 | |
| Stochastique (14,3,5): | 44.70 | |
| TEMA (21): | 16,021.61 | |
| Williams %R (14): | -2.03 | |
| Chande Momentum Oscillator (20): | 70.09 | |
| Repulse (5,40,3): | 0.4200 | |
| ROCnROLL: | 1 | |
| TRIX (15,9): | -0.0300 | |
| Courbe Coppock: | 1.75 |
| MA7: | 16,124.08 | |
| MA20: | 16,043.65 | |
| MA50: | 15,651.94 | |
| MA100: | 14,892.92 | |
| MAexp7: | 16,058.02 | |
| MAexp20: | 16,080.96 | |
| MAexp50: | 16,106.08 | |
| MAexp100: | 16,068.09 | |
| Price / MA7: | +0.58% | |
| Price / MA20: | +1.09% | |
| Price / MA50: | +3.62% | |
| Price / MA100: | +8.90% | |
| Price / MAexp7: | +0.99% | |
| Price / MAexp20: | +0.85% | |
| Price / MAexp50: | +0.69% | |
| Price / MAexp100: | +0.93% |
News
The latest news and videos published on NASDAQ COMPOSITE INDEX at the time of the analysis were as follows:
-
 Nasdaq Composite officially entered bear market
-
Nasdaq Composite Courts Bear Market Territory
-
S&P 500 And Nasdaq Composite Close To Record Highs
-
Biotech Boosts S&P 500 And Nasdaq Composite
-
Nasdaq Composite Hits Record High
About author
Online


Add a comment
Comments
0 comments on the analysis NASDAQ COMPOSITE INDEX - 1H