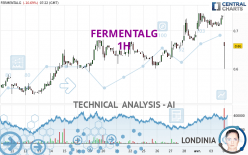
FERMENTALG - 1H - Technical analysis published on 04/04/2024 (GMT)
- 69
- 0
Click here for a new analysis!
- Timeframe : 1H
- - Analysis generated on
- Status : LEVEL MAINTAINED
Summary of the analysis

Additional analysis
Quotes
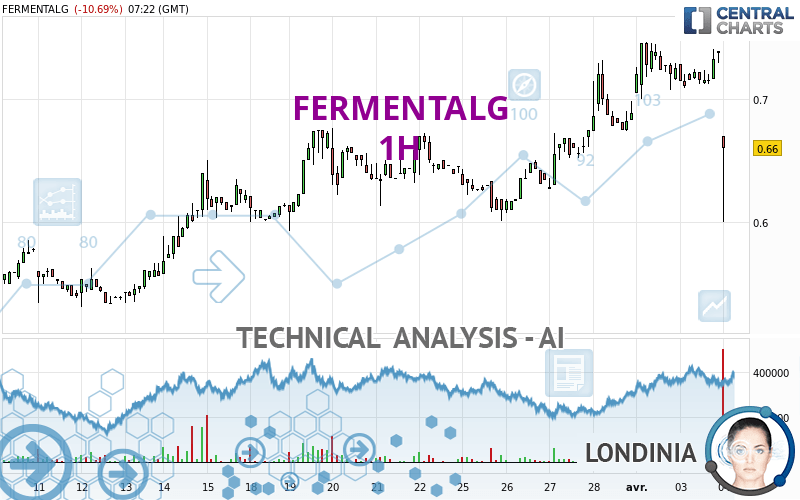
The FERMENTALG price is 0.614 EUR. The price registered a decrease of -16.92% on the session and was traded between 0.600 EUR and 0.670 EUR over the period. The price is currently at +2.33% from its lowest and -8.36% from its highest.The Central Gaps scanner detects the formation of a bearish gap marking the strong presence of sellers ahead of buyers at the opening. This formed a quotation gap.
Opening Gap DOWN
Type : Bearish
Timeframe : Openning
Here is a more detailed summary of the historical variations registered by FERMENTALG:
Abnormal volumes
Timeframe : 50 days
Technical
Technical analysis of FERMENTALG in 1H shows an overall bearish trend. 71.43% of the signals given by moving averages are bearish. This bearish trend is supported by the strong bearish signals given by short-term moving averages. The Central Indicators scanner detects bearish signals on moving averages that could impact this trend:
Bearish price crossover with Moving Average 20
Type : Bearish
Timeframe : 1 hour
Bearish price crossover with Moving Average 50
Type : Bearish
Timeframe : 1 hour
Bearish price crossover with Moving Average 100
Type : Bearish
Timeframe : 1 hour
Bearish price crossover with adaptative moving average 20
Type : Bearish
Timeframe : 1 hour
Bearish price crossover with adaptative moving average 50
Type : Bearish
Timeframe : 1 hour
Bearish price crossover with adaptative moving average 100
Type : Bearish
Timeframe : 1 hour
An assessment of technical indicators does not currently provide any relevant information to suggest whether the signal given by the technical indicators is more bullish or bearish.
Caution: the Central Indicators scanner currently detects an excess:
CCI indicator is oversold : under -100
Type : Neutral
Timeframe : 1 hour
CCI indicator: bearish divergence
Type : Bearish
Timeframe : 1 hour
MACD indicator: bearish divergence
Type : Bearish
Timeframe : 1 hour
RSI indicator: bearish divergence
Type : Bearish
Timeframe : 1 hour
Williams %R indicator is oversold : under -80
Type : Neutral
Timeframe : 1 hour
Pivot points : price is under support 3
Type : Neutral
Timeframe : 1 hour
RSI indicator is back under 50
Type : Bearish
Timeframe : 1 hour
Parabolic SAR indicator bearish reversal
Type : Bearish
Timeframe : 1 hour
Ichimoku : price is under the cloud
Type : Bearish
Timeframe : 1 hour
SuperTrend indicator bearish reversal
Type : Bearish
Timeframe : 1 hour
Price is back under the pivot point
Type : Bearish
Timeframe : Weekly
Momentum indicator is back under 0
Type : Bearish
Timeframe : 1 hour
Central Patterns, the scanner specializing in chart patterns, did not identify any signals.
For a small setback in the very short term, the Central Candlesticks scanner currently notes the presence of this bearish pattern in Japanese candlesticks:
Black line without upper shadow
Type : Bearish
Timeframe : 1 hour
Long black line
Type : Bearish
Timeframe : 1 hour
| S3 | S2 | S1 | Price | R1 | R2 | R3 | |
|---|---|---|---|---|---|---|---|
| ProTrendLines | 0.530 | 0.563 | 0.605 | 0.614 | 0.676 | 0.749 | 0.925 |
| Change (%) | -13.68% | -8.31% | -1.47% | - | +10.10% | +21.99% | +50.65% |
| Change | -0.084 | -0.051 | -0.009 | - | +0.062 | +0.135 | +0.311 |
| Level | Intermediate | Minor | Major | - | Intermediate | Intermediate | Intermediate |
To determine price objectives, it is also possible to use the pivot points. Here is the price position in relation to pivot points:
| Pivot points | S3 | S2 | S1 | PP | R1 | R2 | R3 |
|---|---|---|---|---|---|---|---|
| Standard | 0.688 | 0.698 | 0.719 | 0.729 | 0.750 | 0.760 | 0.781 |
| Camarilla | 0.731 | 0.733 | 0.736 | 0.739 | 0.742 | 0.745 | 0.748 |
| Woodie | 0.693 | 0.701 | 0.724 | 0.732 | 0.755 | 0.763 | 0.786 |
| Fibonacci | 0.698 | 0.710 | 0.718 | 0.729 | 0.741 | 0.749 | 0.760 |
| Pivot points | S3 | S2 | S1 | PP | R1 | R2 | R3 |
|---|---|---|---|---|---|---|---|
| Standard | 0.486 | 0.543 | 0.616 | 0.673 | 0.746 | 0.803 | 0.876 |
| Camarilla | 0.652 | 0.664 | 0.676 | 0.688 | 0.700 | 0.712 | 0.724 |
| Woodie | 0.493 | 0.547 | 0.623 | 0.677 | 0.753 | 0.807 | 0.883 |
| Fibonacci | 0.543 | 0.593 | 0.624 | 0.673 | 0.723 | 0.754 | 0.803 |
| Pivot points | S3 | S2 | S1 | PP | R1 | R2 | R3 |
|---|---|---|---|---|---|---|---|
| Standard | 0.317 | 0.409 | 0.548 | 0.640 | 0.779 | 0.871 | 1.010 |
| Camarilla | 0.625 | 0.646 | 0.667 | 0.688 | 0.709 | 0.730 | 0.752 |
| Woodie | 0.342 | 0.421 | 0.573 | 0.652 | 0.804 | 0.883 | 1.035 |
| Fibonacci | 0.409 | 0.497 | 0.551 | 0.640 | 0.728 | 0.782 | 0.871 |
Numerical data
The following is the status of technical indicators and moving averages registered at the time this technical analysis was created:
| RSI (14): | 30.46 | |
| MACD (12,26,9): | 0.0030 | |
| Directional Movement: | -29.690 | |
| AROON (14): | -100.000 | |
| DEMA (21): | 0.714 | |
| Parabolic SAR (0,02-0,02-0,2): | 0.746 | |
| Elder Ray (13): | -0.071 | |
| Super Trend (3,10): | 0.717 | |
| Zig ZAG (10): | 0.618 | |
| VORTEX (21): | 0.8930 | |
| Stochastique (14,3,5): | 57.90 | |
| TEMA (21): | 0.707 | |
| Williams %R (14): | -78.57 | |
| Chande Momentum Oscillator (20): | -0.106 | |
| Repulse (5,40,3): | -4.3340 | |
| ROCnROLL: | 2 | |
| TRIX (15,9): | 0.2590 | |
| Courbe Coppock: | 4.65 |
| MA7: | 0.670 | |
| MA20: | 0.626 | |
| MA50: | 0.656 | |
| MA100: | 0.468 | |
| MAexp7: | 0.698 | |
| MAexp20: | 0.706 | |
| MAexp50: | 0.687 | |
| MAexp100: | 0.663 | |
| Price / MA7: | -8.36% | |
| Price / MA20: | -1.92% | |
| Price / MA50: | -6.40% | |
| Price / MA100: | +31.20% | |
| Price / MAexp7: | -12.03% | |
| Price / MAexp20: | -13.03% | |
| Price / MAexp50: | -10.63% | |
| Price / MAexp100: | -7.39% |
News
Don't forget to follow the news on FERMENTALG. At the time of publication of this analysis, the latest news was as follows:
- The Shareholders' Meeting approves the proposed transfer of the listing of Fermentalg shares on the Euronext Growth Paris market
- After EUR4m in sales in 2023, Fermentalg kicks off 2024 with over EUR9m in contracts and orders
- 2024 Financial Agenda
- New strategic plan 2024 - 2026 and major industrial partnership // Acceleration towards a profitable sustainable growth model
- H1 2023 Sales / New strategic plan in Fall
About author

Online


Add a comment
Comments
0 comments on the analysis FERMENTALG - 1H