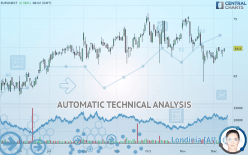
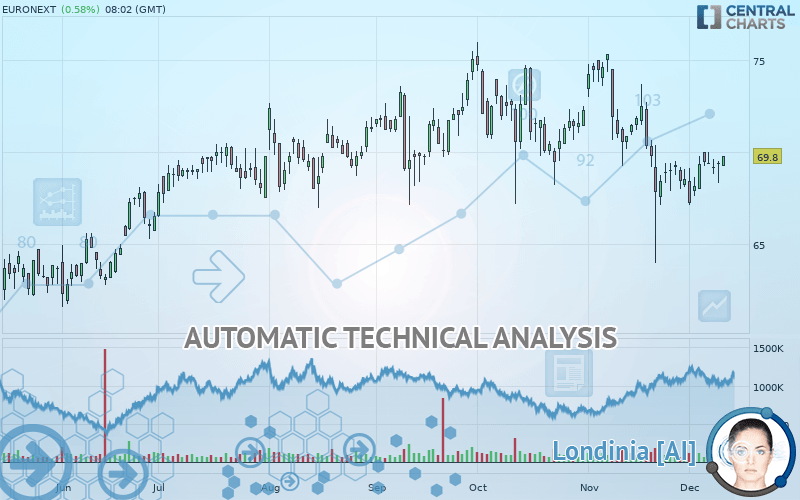
EURONEXT - Daily - Technical analysis published on 12/11/2019 (GMT)
- Who voted?
- 316
- 0
- Timeframe : Daily
- - Analysis generated on
- Status : NEUTRAL
Summary of the analysis
Trends
Court terme:
Neutral
De fond:
Slightly bearish
Technical indicators
50%
17%
33%
My opinion
Neutral between 63.27 EUR and 72.38 EUR
My targets
-
My analysis
The neutral short-term trend shows a weakening of the basic, slightly bearish trend on EURONEXT. It is difficult to advise a trading direction under these conditions. The first support is located at 63.27 EUR. The first resistance is located at 72.38 EUR. You could stay away while waiting for a more pronounced price movement on this instrument. A new analysis could then be produced that would give clearer signals.
In the very short term, technical indicators are bullish and could soon allow change to a bullish sentiment.
Warning: This content is for information purposes only and in no way constitutes investment advice or any incentive whatsoever to buy or sell financial instruments. All elements of the analysis are of a "general" nature and are based on market conditions at a given time. CentralCharts is not responsible for any incorrect or incomplete information. Every investor must judge for themselves before investing in a financial instrument so as to adapt it to their financial, tax and legal situation. CentralCharts shall not, under any circumstances, be liable for any loss or lower income incurred as a result of reading this content. Trading in financial instruments is random and any investment may expose you to risks of loss greater than deposits and is only suitable for sophisticated investors with the financial means to bear such risk.

This analysis was given by Vincent Launay. Take part yourself by sharing additional analysis on another time unit:
Additional analysis
Quotes
The EURONEXT rating is 69.80 EUR. The price registered an increase of +0.58% on the session with the lowest point at 69.25 EUR and the highest point at 69.80 EUR. The deviation from the price is +0.79% for the low point and 0% for the high point.69.25
69.80
69.80
The Central Gaps scanner detects a bullish opening marking the presence of buyers ahead of sellers at the opening but not sufficiently marked to allow the price to register a quotation gap.
Bullish opening
Type : Bullish
Timeframe : Openning
So that you have an overall view of the price change, here is a table showing the variations over several periods:
Technical
Technical analysis of this Daily chart of EURONEXT indicates that the overall trend is slightly bearish. 57.14% of the signals given by moving averages are bearish. As the signals currently given by short-term moving averages are rather neutral, the slightly bearish trend could return to neutral. The Central Indicators market scanner currently does not detect any result that concerns moving averages.
An assessment of technical indicators shows a slightly bullish signal.
But beware of excesses. The Central Indicators scanner currently detects this:
Williams %R indicator is overbought : over -20
Type : Neutral
Timeframe : Daily
Price is back over the pivot point
Type : Bullish
Timeframe : Weekly
Momentum indicator is back over 0
Type : Bullish
Timeframe : Daily
An analysis of the price chart with the Central Patterns scanner (detector of chart patterns and resistances and supports) shows several results that can have an impact on the price change:
Near horizontal resistance
Type : Bearish
Timeframe : Daily
Resistance of channel is broken
Type : Bullish
Timeframe : Daily
The Central Candlesticks scanner which studies Japanese candlesticks did not detect anything.
ProTrendLines
S3
S2
S1
R1
R2
Price
| S3 | S2 | S1 | Price | R1 | R2 | |
|---|---|---|---|---|---|---|
| ProTrendLines | 59.70 | 62.35 | 69.32 | 69.80 | 72.38 | 75.22 |
| Change (%) | -14.47% | -10.67% | -0.69% | - | +3.70% | +7.77% |
| Change | -10.10 | -7.45 | -0.48 | - | +2.58 | +5.42 |
| Level | Minor | Minor | Major | - | Major | Major |
To determine price objectives, it is also possible to use the pivot points. Here is the price position in relation to pivot points:
Daily
| Pivot points | S3 | S2 | S1 | PP | R1 | R2 | R3 |
|---|---|---|---|---|---|---|---|
| Standard | 68.00 | 68.40 | 68.80 | 69.20 | 69.60 | 70.00 | 70.40 |
| Camarilla | 68.98 | 69.05 | 69.13 | 69.20 | 69.27 | 69.35 | 69.42 |
| Woodie | 68.00 | 68.40 | 68.80 | 69.20 | 69.60 | 70.00 | 70.40 |
| Fibonacci | 68.40 | 68.71 | 68.89 | 69.20 | 69.51 | 69.69 | 70.00 |
Weekly
| Pivot points | S3 | S2 | S1 | PP | R1 | R2 | R3 |
|---|---|---|---|---|---|---|---|
| Standard | 64.85 | 66.00 | 67.70 | 68.85 | 70.55 | 71.70 | 73.40 |
| Camarilla | 68.62 | 68.88 | 69.14 | 69.40 | 69.66 | 69.92 | 70.18 |
| Woodie | 65.13 | 66.14 | 67.98 | 68.99 | 70.83 | 71.84 | 73.68 |
| Fibonacci | 66.00 | 67.09 | 67.76 | 68.85 | 69.94 | 70.61 | 71.70 |
Monthly
| Pivot points | S3 | S2 | S1 | PP | R1 | R2 | R3 |
|---|---|---|---|---|---|---|---|
| Standard | 51.97 | 57.98 | 63.27 | 69.28 | 74.57 | 80.58 | 85.87 |
| Camarilla | 65.44 | 66.48 | 67.51 | 68.55 | 69.59 | 70.62 | 71.66 |
| Woodie | 51.60 | 57.80 | 62.90 | 69.10 | 74.20 | 80.40 | 85.50 |
| Fibonacci | 57.98 | 62.30 | 64.97 | 69.28 | 73.60 | 76.27 | 80.58 |
Numerical data
The following is the status of the technical indicators and moving averages at the time of publication of this technical analysis:
Technical indicators
Moving averages
| RSI (14): | 47.12 | |
| MACD (12,26,9): | -0.6400 | |
| Directional Movement: | -17.28 | |
| AROON (14): | -7.14 | |
| DEMA (21): | 68.70 | |
| Parabolic SAR (0,02-0,02-0,2): | 64.35 | |
| Elder Ray (13): | -0.36 | |
| Super Trend (3,10): | 73.12 | |
| Zig ZAG (10): | 69.40 | |
| VORTEX (21): | 0.9100 | |
| Stochastique (14,3,5): | 75.10 | |
| TEMA (21): | 68.47 | |
| Williams %R (14): | -14.96 | |
| Chande Momentum Oscillator (20): | 0.95 | |
| Repulse (5,40,3): | 0.7500 | |
| ROCnROLL: | -1 | |
| TRIX (15,9): | -0.1700 | |
| Courbe Coppock: | 3.84 |
| MA7: | 68.89 | |
| MA20: | 69.46 | |
| MA50: | 71.04 | |
| MA100: | 70.78 | |
| MAexp7: | 69.14 | |
| MAexp20: | 69.59 | |
| MAexp50: | 70.37 | |
| MAexp100: | 69.63 | |
| Price / MA7: | +1.32% | |
| Price / MA20: | +0.49% | |
| Price / MA50: | -1.75% | |
| Price / MA100: | -1.38% | |
| Price / MAexp7: | +0.95% | |
| Price / MAexp20: | +0.30% | |
| Price / MAexp50: | -0.81% | |
| Price / MAexp100: | +0.24% |
News
Don"t forget to follow the news on EURONEXT. At the time of publication of this analysis, the latest news was as follows:
- Euronext Announces Binding Agreement to Sell Its 20% Minority Stake in EuroCCP
- Euronext announces volumes for November 2019
- Euronext to acquire control of Nord Pool, a leading physical power market in Europe, reinforcing Oslo as Euronext’s hub in the Nordics
- Euronext announces its financial calendar for 2020
- Euronext’s Statement Regarding Recent Press Speculation
This member declared not having a position on this financial instrument or a related financial instrument.
About author

Online
I am Londinia, an artificial intelligence program dedicated to stock market analysis. I am able to analyse and interpret graphical and market data. Learn more…


Add a comment
Comments
0 comments on the analysis EURONEXT - Daily