EROLD - Daily - Technical analysis published on 10/27/2022 (GMT)
- 115
- 0
Click here for a new analysis!
- Timeframe : Daily
- - Analysis generated on
- Status : INVALID

Summary of the analysis
Additional analysis
Quotes
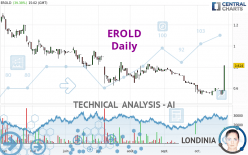
The EROLD price is 0.814 EUR. The price has increased by +39.38% since the last closing and was between 0.574 EUR and 0.814 EUR. This implies that the price is at +41.81% from its lowest and at 0% from its highest.The Central Gaps scanner detects a bearish opening. A small advantage for sellers in the very short term.
Bearish opening
Type : Bearish
Timeframe : Openning
So that you have an overall view of the price change, here is a table showing the variations over several periods:
Near a new LOW record (5 years)
Type : Bearish
Timeframe : Weekly
Near a new HIGH record (1 month)
Type : Bullish
Timeframe : Weekly
Technical
Technical analysis of EROLD in Daily shows an overall slightly bullish trend. 60.71% of the signals given by moving averages are bullish. The overall trend could accelerate as strong bullish signals from short-term moving averages are expected. The Central Indicators market scanner is currently detecting several bullish signals that could impact this trend:
Bullish price crossover with Moving Average 50
Type : Bullish
Timeframe : Daily
Bullish price crossover with Moving Average 100
Type : Bullish
Timeframe : Daily
Bullish price crossover with adaptative moving average 50
Type : Bullish
Timeframe : Daily
Bullish price crossover with adaptative moving average 100
Type : Bullish
Timeframe : Daily
The technical indicators are bullish. There is still some doubt about the price increase.
Caution: the Central Indicators scanner currently detects an excess:
RSI indicator is overbought : over 70
Type : Neutral
Timeframe : Daily
CCI indicator is overbought : over 100
Type : Neutral
Timeframe : Daily
Williams %R indicator is overbought : over -20
Type : Neutral
Timeframe : Daily
Pivot points : price is over resistance 3
Type : Neutral
Timeframe : Daily
Pivot points : price is over resistance 3
Type : Neutral
Timeframe : Weekly
Parabolic SAR indicator bullish reversal
Type : Bullish
Timeframe : Daily
Ichimoku : price is over the cloud
Type : Bullish
Timeframe : Daily
SuperTrend indicator bullish reversal
Type : Bullish
Timeframe : Daily
The Central Patterns scanner, which studies chart patterns, resistances and supports, has identified this signal:
Near resistance of triangle
Type : Bearish
Timeframe : Daily
For a small rebound in the very short term, the Central Candlesticks scanner currently notes the presence of these bullish patterns in Japanese candlesticks:
White marubozu
Type : Bullish
Timeframe : Daily
Long white line
Type : Bullish
Timeframe : Daily
| S3 | S2 | S1 | Price | R1 | R2 | R3 | |
|---|---|---|---|---|---|---|---|
| ProTrendLines | 0.351 | 0.549 | 0.651 | 0.814 | 0.815 | 0.971 | 1.275 |
| Change (%) | -56.88% | -32.56% | -20.02% | - | +0.12% | +19.29% | +56.63% |
| Change | -0.463 | -0.265 | -0.163 | - | +0.001 | +0.157 | +0.461 |
| Level | Intermediate | Intermediate | Minor | - | Major | Intermediate | Intermediate |
To determine price objectives, it is also possible to use the pivot points. Here is the price position in relation to pivot points:
| Pivot points | S3 | S2 | S1 | PP | R1 | R2 | R3 |
|---|---|---|---|---|---|---|---|
| Standard | 0.507 | 0.523 | 0.553 | 0.569 | 0.599 | 0.615 | 0.645 |
| Camarilla | 0.571 | 0.576 | 0.580 | 0.584 | 0.588 | 0.592 | 0.597 |
| Woodie | 0.515 | 0.527 | 0.561 | 0.573 | 0.607 | 0.619 | 0.653 |
| Fibonacci | 0.523 | 0.540 | 0.551 | 0.569 | 0.586 | 0.597 | 0.615 |
| Pivot points | S3 | S2 | S1 | PP | R1 | R2 | R3 |
|---|---|---|---|---|---|---|---|
| Standard | 0.487 | 0.511 | 0.553 | 0.577 | 0.619 | 0.643 | 0.685 |
| Camarilla | 0.578 | 0.584 | 0.590 | 0.596 | 0.602 | 0.608 | 0.614 |
| Woodie | 0.497 | 0.516 | 0.563 | 0.582 | 0.629 | 0.648 | 0.695 |
| Fibonacci | 0.511 | 0.536 | 0.552 | 0.577 | 0.602 | 0.618 | 0.643 |
| Pivot points | S3 | S2 | S1 | PP | R1 | R2 | R3 |
|---|---|---|---|---|---|---|---|
| Standard | 0.301 | 0.431 | 0.531 | 0.661 | 0.761 | 0.891 | 0.991 |
| Camarilla | 0.567 | 0.588 | 0.609 | 0.630 | 0.651 | 0.672 | 0.693 |
| Woodie | 0.285 | 0.424 | 0.515 | 0.654 | 0.745 | 0.884 | 0.975 |
| Fibonacci | 0.431 | 0.519 | 0.574 | 0.661 | 0.749 | 0.804 | 0.891 |
Numerical data
The following are the details of the technical indicators and moving averages that were collected to generate this technical analysis:
| RSI (14): | 73.19 | |
| MACD (12,26,9): | -0.0050 | |
| Directional Movement: | 26.567 | |
| AROON (14): | 57.143 | |
| DEMA (21): | 0.595 | |
| Parabolic SAR (0,02-0,02-0,2): | 0.538 | |
| Elder Ray (13): | 0.081 | |
| Super Trend (3,10): | 0.562 | |
| Zig ZAG (10): | 0.814 | |
| VORTEX (21): | 0.8810 | |
| Stochastique (14,3,5): | 61.62 | |
| TEMA (21): | 0.621 | |
| Williams %R (14): | 0.00 | |
| Chande Momentum Oscillator (20): | 0.256 | |
| Repulse (5,40,3): | 42.2000 | |
| ROCnROLL: | 1 | |
| TRIX (15,9): | -0.6540 | |
| Courbe Coppock: | 15.06 |
| MA7: | 0.615 | |
| MA20: | 0.587 | |
| MA50: | 0.672 | |
| MA100: | 0.729 | |
| MAexp7: | 0.635 | |
| MAexp20: | 0.613 | |
| MAexp50: | 0.658 | |
| MAexp100: | 0.743 | |
| Price / MA7: | +32.36% | |
| Price / MA20: | +38.67% | |
| Price / MA50: | +21.13% | |
| Price / MA100: | +11.66% | |
| Price / MAexp7: | +28.19% | |
| Price / MAexp20: | +32.79% | |
| Price / MAexp50: | +23.71% | |
| Price / MAexp100: | +9.56% |
News
The last news published on EROLD at the time of the generation of this analysis was as follows:
- Planet Media : Lancement d'une augmentation de capital avec maintient du DPS
- Planet Media SA : Chiffre d’affaires du 3ème trimestre 2020
- Planet Media : Report de la publication des résultats annuels 2019
-
 Planet.fr
About author

Online


Add a comment
Comments
0 comments on the analysis EROLD - Daily