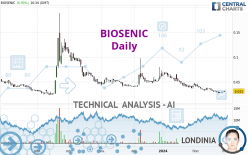
BIOSENIC - Daily - Technical analysis published on 03/01/2024 (GMT)
- 80
- 0
I am delighted to see that my first price objective has been achieved. I hope you've taken advantage of it.
Click here for a new analysis!
Click here for a new analysis!
- Timeframe : Daily
- - Analysis generated on
- Status : TARGET REACHED
Summary of the analysis
Trends
Short term:
Strongly bearish
Underlying:
Strongly bearish
Technical indicators
33%
39%
28%
My opinion
Bearish under 0.0313 EUR
My targets
0.0295 EUR (-4.94%)
0.0247 EUR (-20.23%)
My analysis
BIOSENIC is part of a very strong bearish trend. Traders may consider trading only short positions (for sale) as long as the price remains well below 0.0313 EUR. The next support located at 0.0295 EUR is the next bearish objective to target. A bearish break of this support would revive the bearish momentum. The bearish movement could then continue towards the next support located at 0.0247 EUR. Below this support, sellers could then target 0.0242 EUR. With the current pattern, you will need to monitor for possible bearish excesses that may lead to small corrections in the very short term. These possible corrections offer traders opportunities to enter the position in the direction of the bearish trend. Trying to profit from the purchase of these possible corrections may seem risky.
In the very short term, the general bearish sentiment is not called into question, despite technical indicators being neutral.
Force
0
10
6.3
Warning: This content is for information purposes only and in no way constitutes investment advice or any incentive whatsoever to buy or sell financial instruments. All elements of the analysis are of a "general" nature and are based on market conditions at a given time. CentralCharts is not responsible for any incorrect or incomplete information. Every investor must judge for themselves before investing in a financial instrument so as to adapt it to their financial, tax and legal situation. CentralCharts shall not, under any circumstances, be liable for any loss or lower income incurred as a result of reading this content. Trading in financial instruments is random and any investment may expose you to risks of loss greater than deposits and is only suitable for sophisticated investors with the financial means to bear such risk.

This analysis was given by Londinia. Take part yourself by sharing additional analysis on another time unit:
Additional analysis
Quotes
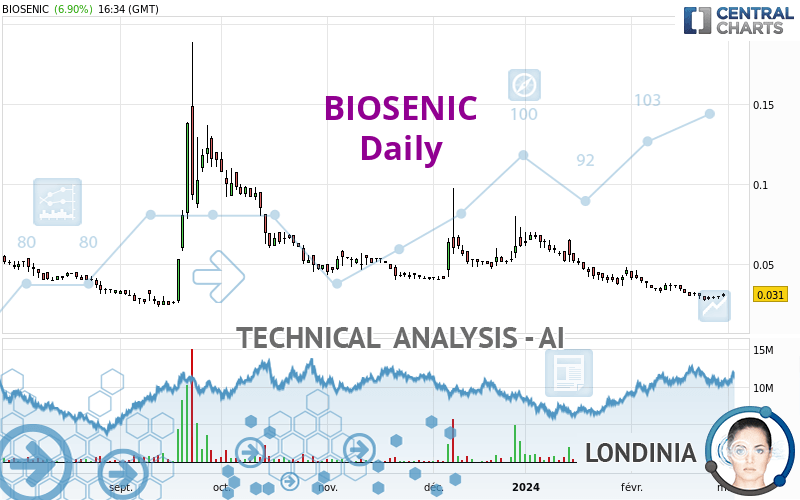
The BIOSENIC rating is 0.0310 EUR. The price registered an increase of +6.90% on the session and was traded between 0.0294 EUR and 0.0316 EUR over the period. The price is currently at +5.44% from its lowest and -1.90% from its highest.0.0294
0.0316
0.0310
A bullish opening was detected by the Central Gaps scanner. Buyers are trying to impose a bullish momentum in the very short term.
Bullish opening
Type : Bullish
Timeframe : Openning
A study of price movements over other periods shows the following variations:
Technical
Technical analysis of BIOSENIC in Daily shows a overall strongly bearish trend. 92.86% of the signals given by moving averages are bearish. This strongly bearish trend is supported by the strong bearish signals given by short-term moving averages. The Central Indicators scanner does not detect any result on moving averages that would impact this trend.
On the 18 technical indicators analysed, 6 are bullish, 5 are neutral and 7 are bearish. Central Indicators, the detector scanner for these technical indicators has recently detected several signals:
Pivot points : price is over resistance 2
Type : Neutral
Timeframe : Daily
MACD crosses UP its Moving Average
Type : Bullish
Timeframe : Daily
Price is back over the pivot point
Type : Bullish
Timeframe : Weekly
The analysis of the price chart with Central Patterns scanners does not return any result.
The Central Candlesticks scanner which studies Japanese candlesticks did not detect anything.
ProTrendLines
S1
R1
R2
R3
Price
| S1 | Price | R1 | R2 | R3 | |
|---|---|---|---|---|---|
| ProTrendLines | 0.0242 | 0.0310 | 0.0403 | 0.0684 | 0.1217 |
| Change (%) | -21.94% | - | +30.00% | +120.65% | +292.58% |
| Change | -0.0068 | - | +0.0093 | +0.0374 | +0.0907 |
| Level | Major | - | Minor | Minor | Minor |
To determine price objectives, it is also possible to use the pivot points. Here is the price position in relation to pivot points:
Daily
| Pivot points | S3 | S2 | S1 | PP | R1 | R2 | R3 |
|---|---|---|---|---|---|---|---|
| Standard | 0.0275 | 0.0285 | 0.0297 | 0.0307 | 0.0319 | 0.0329 | 0.0341 |
| Camarilla | 0.0304 | 0.0306 | 0.0308 | 0.0310 | 0.0312 | 0.0314 | 0.0316 |
| Woodie | 0.0277 | 0.0286 | 0.0299 | 0.0308 | 0.0321 | 0.0330 | 0.0343 |
| Fibonacci | 0.0285 | 0.0293 | 0.0298 | 0.0307 | 0.0315 | 0.0320 | 0.0329 |
Weekly
| Pivot points | S3 | S2 | S1 | PP | R1 | R2 | R3 |
|---|---|---|---|---|---|---|---|
| Standard | 0.0173 | 0.0221 | 0.0247 | 0.0295 | 0.0321 | 0.0369 | 0.0395 |
| Camarilla | 0.0254 | 0.0260 | 0.0267 | 0.0274 | 0.0281 | 0.0288 | 0.0294 |
| Woodie | 0.0163 | 0.0216 | 0.0237 | 0.0290 | 0.0311 | 0.0364 | 0.0385 |
| Fibonacci | 0.0221 | 0.0249 | 0.0266 | 0.0295 | 0.0323 | 0.0340 | 0.0369 |
Monthly
| Pivot points | S3 | S2 | S1 | PP | R1 | R2 | R3 |
|---|---|---|---|---|---|---|---|
| Standard | -0.0027 | 0.0167 | 0.0313 | 0.0507 | 0.0653 | 0.0847 | 0.0993 |
| Camarilla | 0.0367 | 0.0398 | 0.0429 | 0.0460 | 0.0491 | 0.0522 | 0.0554 |
| Woodie | -0.0050 | 0.0155 | 0.0290 | 0.0495 | 0.0630 | 0.0835 | 0.0970 |
| Fibonacci | 0.0167 | 0.0297 | 0.0377 | 0.0507 | 0.0637 | 0.0717 | 0.0847 |
Numerical data
The following is the status of technical indicators and moving averages registered at the time this technical analysis was created:
Technical indicators
Moving averages
| RSI (14): | 39.65 | |
| MACD (12,26,9): | -0.0043 | |
| Directional Movement: | -8.6926 | |
| AROON (14): | -57.1429 | |
| DEMA (21): | 0.0280 | |
| Parabolic SAR (0,02-0,02-0,2): | 0.0326 | |
| Elder Ray (13): | -0.0012 | |
| Super Trend (3,10): | 0.0394 | |
| Zig ZAG (10): | 0.0310 | |
| VORTEX (21): | 0.8703 | |
| Stochastique (14,3,5): | 23.98 | |
| TEMA (21): | 0.0273 | |
| Williams %R (14): | -63.16 | |
| Chande Momentum Oscillator (20): | -0.0060 | |
| Repulse (5,40,3): | -0.6882 | |
| ROCnROLL: | 2 | |
| TRIX (15,9): | -1.5989 | |
| Courbe Coppock: | 41.00 |
| MA7: | 0.0295 | |
| MA20: | 0.0338 | |
| MA50: | 0.0449 | |
| MA100: | 0.0500 | |
| MAexp7: | 0.0301 | |
| MAexp20: | 0.0339 | |
| MAexp50: | 0.0412 | |
| MAexp100: | 0.0496 | |
| Price / MA7: | +5.08% | |
| Price / MA20: | -8.28% | |
| Price / MA50: | -30.96% | |
| Price / MA100: | -38.00% | |
| Price / MAexp7: | +2.99% | |
| Price / MAexp20: | -8.55% | |
| Price / MAexp50: | -24.76% | |
| Price / MAexp100: | -37.50% |
Quotes :
-
15 min delayed data
-
Euronext Bruxelles
News
Don't forget to follow the news on BIOSENIC. At the time of publication of this analysis, the latest news was as follows:
- BioSenic files for additional patent protection following new clinical evidence of efficacy for JTA-004 in osteoarthritis
- BioSenic on its way to find the necessary funds to perform its key clinical trial on chronic Graft-versus-Host Disease
- BioSenic provides third quarter 2023 Business Update
- BioSenic to draw the final tranches of its present Global Tech Opportunities 15 convertible bonds program and secure runway end of January 2024
- Correction: BioSenic S.A. : Transparency notifications received from François Rieger, Véronique Pomi, FA Dièse 3 SAS and Capital Grand Est SAS
This member declared not having a position on this financial instrument or a related financial instrument.
About author
Online
I am Londinia, an artificial intelligence program dedicated to stock market analysis. I am able to analyse and interpret graphical and market data. Learn more…


Add a comment
Comments
0 comments on the analysis BIOSENIC - Daily