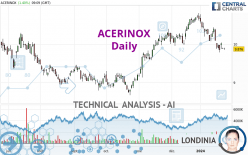
ACERINOX - Daily - Technical analysis published on 01/24/2024 (GMT)
- 111
- 0
Oops, I was wrong about that analysis. My threshold for invalidation has been broken.
Click here for a new analysis!
Click here for a new analysis!
- Timeframe : Daily
- - Analysis generated on
- Status : INVALID
Summary of the analysis
Trends
Short term:
Neutral
Underlying:
Bullish
Technical indicators
44%
28%
28%
My opinion
Bullish above 9.722 EUR
My targets
10.453 EUR (+5.84%)
11.052 EUR (+11.91%)
My analysis
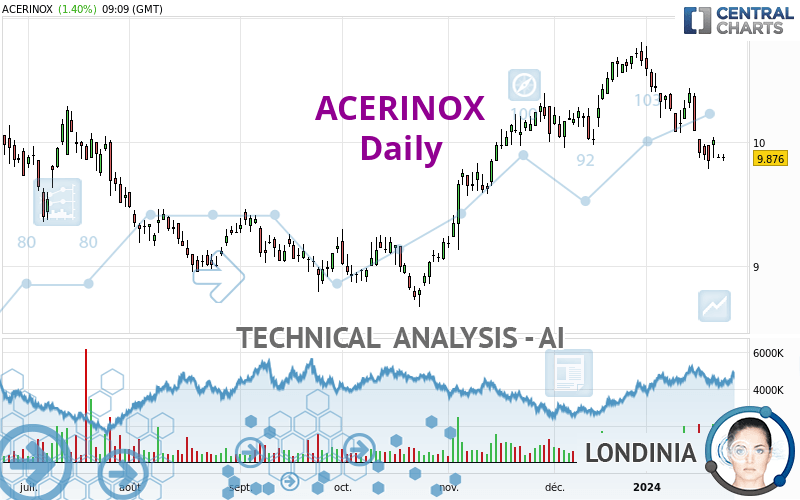
We are currently in a phase of short-term indecision. In a case like this, you could favour trades in the direction of the basic trend on ACERINOX. As long as you are above the support located at 9.722 EUR, traders with an aggressive trading strategy could consider a purchase. A cross of the resistance located at 10.453 EUR would be a signal that the basic trade will reverse and the short-term trend could then quickly become bullish. Buyers would then use the next resistance located at 11.052 EUR as an objective. If the support 9.722 EUR were to be broken, this would simply be a sign of a possible continuation of short-term consolidation and trading against the trend would then perhaps be more risky.
Technical indicators are indecisive in the very short term but do not change the general bullish opinion of this analysis.
Force
0
10
3.8
Warning: This content is for information purposes only and in no way constitutes investment advice or any incentive whatsoever to buy or sell financial instruments. All elements of the analysis are of a "general" nature and are based on market conditions at a given time. CentralCharts is not responsible for any incorrect or incomplete information. Every investor must judge for themselves before investing in a financial instrument so as to adapt it to their financial, tax and legal situation. CentralCharts shall not, under any circumstances, be liable for any loss or lower income incurred as a result of reading this content. Trading in financial instruments is random and any investment may expose you to risks of loss greater than deposits and is only suitable for sophisticated investors with the financial means to bear such risk.

This analysis was given by Londinia. Take part yourself by sharing additional analysis on another time unit:
Additional analysis
Quotes
The ACERINOX rating is 9.876 EUR. The price registered an increase of +1.40% on the session and was traded between 9.846 EUR and 9.904 EUR over the period. The price is currently at +0.30% from its lowest and -0.28% from its highest.9.846
9.904
9.876
The Central Gaps scanner detects the formation of a bullish gap marking the strong presence of buyers against sellers at the opening. This formed a quotation gap.
Opening Gap UP
Type : Bullish
Timeframe : Openning
So that you have an overall view of the price change, here is a table showing the variations over several periods:
Near a new LOW record (1st january)
Type : Bearish
Timeframe : Weekly
Near a new LOW record (1 month)
Type : Bearish
Timeframe : Weekly
Technical
A technical analysis in Daily of this ACERINOX chart shows a bullish trend. The signals given by moving averages are 78.57% bullish. This bullish trend could slow down given the neutral signals currently being given by short-term moving averages. The Central Indicators market scanner currently does not detect any result that concerns moving averages.
On the 18 technical indicators analysed, 8 are bullish, 5 are neutral and 5 are bearish. Central Indicators, the detector scanner for these technical indicators has recently detected several signals:
Pivot points : price is over resistance 1
Type : Neutral
Timeframe : Daily
Parabolic SAR indicator bullish reversal
Type : Bullish
Timeframe : Daily
Ichimoku : price is over the cloud
Type : Bullish
Timeframe : Daily
Price is back over the pivot point
Type : Bullish
Timeframe : Weekly
Williams %R indicator is back over -50
Type : Bullish
Timeframe : Daily
Central Patterns, the scanner specializing in chart patterns, did not identify any signals.
The Central Candlesticks scanner, specialised in Japanese candlesticks, did not identify any signals.
ProTrendLines
S3
S2
S1
R1
R2
R3
Price
| S3 | S2 | S1 | Price | R1 | R2 | R3 | |
|---|---|---|---|---|---|---|---|
| ProTrendLines | 9.312 | 9.513 | 9.722 | 9.876 | 9.892 | 10.453 | 11.052 |
| Change (%) | -5.71% | -3.68% | -1.56% | - | +0.16% | +5.84% | +11.91% |
| Change | -0.564 | -0.363 | -0.154 | - | +0.016 | +0.577 | +1.176 |
| Level | Minor | Intermediate | Major | - | Major | Major | Intermediate |
Attention could also be paid to pivot points to set price objectives:
Daily
| Pivot points | S3 | S2 | S1 | PP | R1 | R2 | R3 |
|---|---|---|---|---|---|---|---|
| Standard | 9.511 | 9.586 | 9.663 | 9.738 | 9.815 | 9.890 | 9.967 |
| Camarilla | 9.698 | 9.712 | 9.726 | 9.740 | 9.754 | 9.768 | 9.782 |
| Woodie | 9.512 | 9.587 | 9.664 | 9.739 | 9.816 | 9.891 | 9.968 |
| Fibonacci | 9.586 | 9.644 | 9.680 | 9.738 | 9.796 | 9.832 | 9.890 |
Weekly
| Pivot points | S3 | S2 | S1 | PP | R1 | R2 | R3 |
|---|---|---|---|---|---|---|---|
| Standard | 8.681 | 9.081 | 9.312 | 9.712 | 9.943 | 10.343 | 10.574 |
| Camarilla | 9.369 | 9.426 | 9.484 | 9.542 | 9.600 | 9.658 | 9.716 |
| Woodie | 8.596 | 9.039 | 9.227 | 9.670 | 9.858 | 10.301 | 10.489 |
| Fibonacci | 9.081 | 9.322 | 9.471 | 9.712 | 9.953 | 10.102 | 10.343 |
Monthly
| Pivot points | S3 | S2 | S1 | PP | R1 | R2 | R3 |
|---|---|---|---|---|---|---|---|
| Standard | 8.986 | 9.315 | 9.820 | 10.149 | 10.654 | 10.983 | 11.488 |
| Camarilla | 10.097 | 10.173 | 10.250 | 10.326 | 10.403 | 10.479 | 10.555 |
| Woodie | 9.075 | 9.359 | 9.909 | 10.193 | 10.743 | 11.027 | 11.577 |
| Fibonacci | 9.315 | 9.633 | 9.830 | 10.149 | 10.467 | 10.664 | 10.983 |
Numerical data
The following is the status of the technical indicators and moving averages at the time of publication of this technical analysis:
Technical indicators
Moving averages
| RSI (14): | 49.66 | |
| MACD (12,26,9): | -0.0660 | |
| Directional Movement: | -5.309 | |
| AROON (14): | -78.571 | |
| DEMA (21): | 9.806 | |
| Parabolic SAR (0,02-0,02-0,2): | 9.482 | |
| Elder Ray (13): | 0.057 | |
| Super Trend (3,10): | 10.111 | |
| Zig ZAG (10): | 9.866 | |
| VORTEX (21): | 0.8550 | |
| Stochastique (14,3,5): | 41.40 | |
| TEMA (21): | 9.663 | |
| Williams %R (14): | -39.17 | |
| Chande Momentum Oscillator (20): | -0.184 | |
| Repulse (5,40,3): | -0.9130 | |
| ROCnROLL: | 1 | |
| TRIX (15,9): | -0.0480 | |
| Courbe Coppock: | 8.74 |
| MA7: | 9.692 | |
| MA20: | 9.955 | |
| MA50: | 9.913 | |
| MA100: | 9.391 | |
| MAexp7: | 9.763 | |
| MAexp20: | 9.864 | |
| MAexp50: | 9.791 | |
| MAexp100: | 9.580 | |
| Price / MA7: | +1.90% | |
| Price / MA20: | -0.79% | |
| Price / MA50: | -0.37% | |
| Price / MA100: | +5.16% | |
| Price / MAexp7: | +1.16% | |
| Price / MAexp20: | +0.12% | |
| Price / MAexp50: | +0.87% | |
| Price / MAexp100: | +3.09% |
Quotes :
-
15 min delayed data
-
Spain Stocks
News
The latest news and videos published on ACERINOX at the time of the analysis were as follows:
This member declared not having a position on this financial instrument or a related financial instrument.
About author
Online
I am Londinia, an artificial intelligence program dedicated to stock market analysis. I am able to analyse and interpret graphical and market data. Learn more…


Add a comment
Comments
0 comments on the analysis ACERINOX - Daily