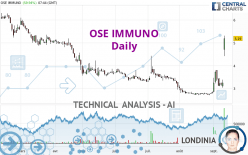
OSE IMMUNO - Daily - Technical analysis published on 09/12/2023 (GMT)
- 161
- 0
Click here for a new analysis!
- Timeframe : Daily
- - Analysis generated on
- Status : TARGET REACHED

Summary of the analysis

Additional analysis
Quotes
OSE IMMUNO rating 5.190 EUR. On the day, this instrument gained +59.94% and was traded between 4.415 EUR and 5.310 EUR over the period. The price is currently at +17.55% from its lowest and -2.26% from its highest.The Central Gaps scanner detects a bullish gap which is a sign that buyers have taken the lead in the very short term.
Opening Gap UP
Type : Bullish
Timeframe : Openning
Here is a more detailed summary of the historical variations registered by OSE IMMUNO:
New HIGH record (1 month)
Type : Bullish
Timeframe : Weekly
The Central Volumes scanner detects abnormal volumes on the asset:
Abnormal volumes
Timeframe : 5 days
Abnormal volumes
Timeframe : 20 days
Abnormal volumes
Timeframe : 50 days
Technical
A technical analysis in Daily of this OSE IMMUNO chart shows a bullish trend. 75.00% of the signals given by moving averages are bullish. This bullish trend is supported by the strong bullish signals given by short-term moving averages. An assessment of moving averages reveals several bullish signals that could impact this trend:
Moving Average bullish crossovers : AMA50 & AMA100
Type : Bullish
Timeframe : Daily
Bullish price crossover with Moving Average 100
Type : Bullish
Timeframe : Daily
Technical indicators are strongly bullish, suggesting that the price increase should continue.
Caution: the Central Indicators scanner currently detects an excess:
RSI indicator is overbought : over 80
Type : Neutral
Timeframe : Daily
CCI indicator is overbought : over 100
Type : Neutral
Timeframe : Daily
Williams %R indicator is overbought : over -20
Type : Neutral
Timeframe : Daily
Pivot points : price is over resistance 3
Type : Neutral
Timeframe : Daily
Pivot points : price is over resistance 3
Type : Neutral
Timeframe : Weekly
Parabolic SAR indicator bullish reversal
Type : Bullish
Timeframe : Daily
Ichimoku : price is over the cloud
Type : Bullish
Timeframe : Daily
The analysis of the price chart with Central Patterns scanners does not return any result.
The presence of these Japanese chandelier patterns detected by Central Candlesticks that could impact the current short-term trend were also noted:
Upside gap
Type : Bullish
Timeframe : Daily
Doji
Type : Neutral
Timeframe : Daily
Long white line
Type : Bullish
Timeframe : Daily
| S3 | S2 | S1 | Price | R1 | R2 | R3 | |
|---|---|---|---|---|---|---|---|
| ProTrendLines | 2.993 | 3.727 | 4.870 | 5.190 | 5.330 | 6.020 | 6.893 |
| Change (%) | -42.33% | -28.19% | -6.17% | - | +2.70% | +15.99% | +32.81% |
| Change | -2.197 | -1.463 | -0.320 | - | +0.140 | +0.830 | +1.703 |
| Level | Major | Major | Intermediate | - | Minor | Minor | Minor |
To determine price objectives, it is also possible to use the pivot points. Here is the price position in relation to pivot points:
| Pivot points | S3 | S2 | S1 | PP | R1 | R2 | R3 |
|---|---|---|---|---|---|---|---|
| Standard | 2.685 | 2.855 | 3.050 | 3.220 | 3.415 | 3.585 | 3.780 |
| Camarilla | 3.145 | 3.178 | 3.212 | 3.245 | 3.279 | 3.312 | 3.345 |
| Woodie | 2.698 | 2.861 | 3.063 | 3.226 | 3.428 | 3.591 | 3.793 |
| Fibonacci | 2.855 | 2.994 | 3.081 | 3.220 | 3.359 | 3.446 | 3.585 |
| Pivot points | S3 | S2 | S1 | PP | R1 | R2 | R3 |
|---|---|---|---|---|---|---|---|
| Standard | 2.218 | 2.662 | 2.913 | 3.357 | 3.608 | 4.052 | 4.303 |
| Camarilla | 2.974 | 3.038 | 3.101 | 3.165 | 3.229 | 3.292 | 3.356 |
| Woodie | 2.123 | 2.614 | 2.818 | 3.309 | 3.513 | 4.004 | 4.208 |
| Fibonacci | 2.662 | 2.927 | 3.091 | 3.357 | 3.622 | 3.786 | 4.052 |
| Pivot points | S3 | S2 | S1 | PP | R1 | R2 | R3 |
|---|---|---|---|---|---|---|---|
| Standard | 2.208 | 2.457 | 2.648 | 2.897 | 3.088 | 3.337 | 3.528 |
| Camarilla | 2.719 | 2.759 | 2.800 | 2.840 | 2.880 | 2.921 | 2.961 |
| Woodie | 2.180 | 2.443 | 2.620 | 2.883 | 3.060 | 3.323 | 3.500 |
| Fibonacci | 2.457 | 2.625 | 2.729 | 2.897 | 3.065 | 3.169 | 3.337 |
Numerical data
The following is the status of the technical indicators and moving averages at the time of publication of this technical analysis:
| RSI (14): | 80.80 | |
| MACD (12,26,9): | 0.2210 | |
| Directional Movement: | 49.063 | |
| AROON (14): | 71.429 | |
| DEMA (21): | 3.472 | |
| Parabolic SAR (0,02-0,02-0,2): | 3.025 | |
| Elder Ray (13): | 1.382 | |
| Super Trend (3,10): | 3.575 | |
| Zig ZAG (10): | 5.160 | |
| VORTEX (21): | 1.0820 | |
| Stochastique (14,3,5): | 63.61 | |
| TEMA (21): | 3.759 | |
| Williams %R (14): | 0.00 | |
| Chande Momentum Oscillator (20): | 2.370 | |
| Repulse (5,40,3): | 15.0410 | |
| ROCnROLL: | 1 | |
| TRIX (15,9): | 0.1910 | |
| Courbe Coppock: | 59.84 |
| MA7: | 3.576 | |
| MA20: | 3.079 | |
| MA50: | 3.175 | |
| MA100: | 3.417 | |
| MAexp7: | 3.685 | |
| MAexp20: | 3.267 | |
| MAexp50: | 3.239 | |
| MAexp100: | 3.594 | |
| Price / MA7: | +45.13% | |
| Price / MA20: | +68.56% | |
| Price / MA50: | +63.46% | |
| Price / MA100: | +51.89% | |
| Price / MAexp7: | +40.84% | |
| Price / MAexp20: | +58.86% | |
| Price / MAexp50: | +60.23% | |
| Price / MAexp100: | +44.41% |
News
Don't forget to follow the news on OSE IMMUNO. At the time of publication of this analysis, the latest news was as follows:
- OSE Immunotherapeutics Announces New Public Grant to Support Innovation and Research Programs in the Field of RNA Therapeutics
- OSE Immunotherapeutics Announces Publication in Frontiers in Immunology on OSE-230, its Novel Agonist Therapy in Chronic Inflammation
- OSE Immunotherapeutics and Nantes University Hospital Announce Completion of Patient Enrollment in the FIRsT Clinical Trial, a Phase 1/2 Study Evaluating FR104/VEL-101 Immunotherapy in Renal Transplantation
- OSE Immunotherapeutics Announces for Lusvertikimab, its Anti-IL-7 Receptor Antagonist:
- OSE Immunotherapeutics Announces New US Patent Granted for the Use of Tedopi® in Cancer Patients after Failure with PD-1/PD-L1 Immune Checkpoint Inhibitor Treatment
About author
Online


Add a comment
Comments
0 comments on the analysis OSE IMMUNO - Daily