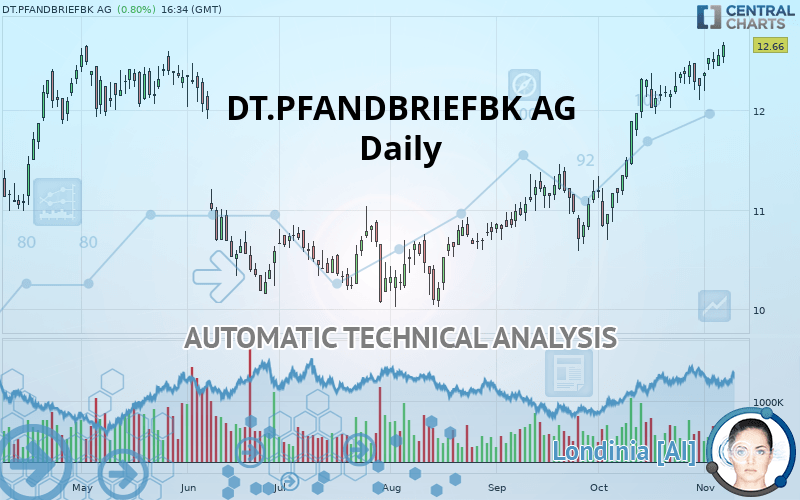
DT.PFANDBRIEFBK AG - Daily - Technical analysis published on 11/07/2019 (GMT)
- Who voted?
- 202
- 0
Click here for a new analysis!
- Timeframe : Daily
- - Analysis generated on
- Status : TARGET REACHED

Summary of the analysis

Additional analysis
Quotes
The DT.PFANDBRIEFBK AG price is 12.66 EUR. On the day, this instrument gained +0.80% and was traded between 12.48 EUR and 12.69 EUR over the period. The price is currently at +1.44% from its lowest and -0.24% from its highest.A bearish opening was detected by the Central Gaps scanner. Sellers are trying to impose a bearish trend in the very short term.
Bearish opening
Type : Bearish
Timeframe : Openning
Here is a more detailed summary of the historical variations registered by DT.PFANDBRIEFBK AG:
New HIGH record (1 year)
Type : Bullish
Timeframe : Weekly
New HIGH record (1st january)
Type : Bullish
Timeframe : Weekly
New HIGH record (1 month)
Type : Bullish
Timeframe : Weekly
Technical
A technical analysis in Daily of this DT.PFANDBRIEFBK AG chart shows a strongly bullish trend. The signals given by the moving averages are 92.86% bullish. This strong bullish trend is confirmed by the strong signals currently being given by short-term moving averages. There is no crossing of moving average by the price or crossing of moving averages between themselves.
Technical indicators are strongly bullish, suggesting that the price increase should continue.
Caution: the Central Indicators scanner currently detects an excess:
RSI indicator is overbought : over 70
Type : Neutral
Timeframe : Daily
CCI indicator is overbought : over 100
Type : Neutral
Timeframe : Daily
Williams %R indicator is overbought : over -20
Type : Neutral
Timeframe : Daily
Pivot points : price is over resistance 1
Type : Neutral
Timeframe : Daily
Pivot points : price is over resistance 1
Type : Neutral
Timeframe : Weekly
The Central Patterns scanner, which studies chart patterns, resistances and supports, has identified this signal:
Near horizontal support
Type : Bullish
Timeframe : Daily
The presence of a bullish Japanese candlestick pattern detected by Central Candlesticks that could cause a very short term rebound was also detected:
Bullish engulfing lines
Type : Bullish
Timeframe : Daily
| S3 | S2 | S1 | Price | R1 | R2 | R3 | |
|---|---|---|---|---|---|---|---|
| ProTrendLines | 10.43 | 10.84 | 12.56 | 12.66 | 13.27 | 13.88 | 15.28 |
| Change (%) | -17.61% | -14.38% | -0.79% | - | +4.82% | +9.64% | +20.70% |
| Change | -2.23 | -1.82 | -0.10 | - | +0.61 | +1.22 | +2.62 |
| Level | Intermediate | Intermediate | Major | - | Minor | Minor | Intermediate |
Pivot points can also be used to set your price objectives. Here is the price situation in relation to pivot points:
| Pivot points | S3 | S2 | S1 | PP | R1 | R2 | R3 |
|---|---|---|---|---|---|---|---|
| Standard | 12.30 | 12.37 | 12.47 | 12.54 | 12.64 | 12.71 | 12.81 |
| Camarilla | 12.51 | 12.53 | 12.54 | 12.56 | 12.58 | 12.59 | 12.61 |
| Woodie | 12.31 | 12.38 | 12.48 | 12.55 | 12.65 | 12.72 | 12.82 |
| Fibonacci | 12.37 | 12.44 | 12.48 | 12.54 | 12.61 | 12.65 | 12.71 |
| Pivot points | S3 | S2 | S1 | PP | R1 | R2 | R3 |
|---|---|---|---|---|---|---|---|
| Standard | 11.77 | 11.94 | 12.16 | 12.33 | 12.55 | 12.72 | 12.94 |
| Camarilla | 12.27 | 12.31 | 12.34 | 12.38 | 12.42 | 12.45 | 12.49 |
| Woodie | 11.80 | 11.95 | 12.19 | 12.34 | 12.58 | 12.73 | 12.97 |
| Fibonacci | 11.94 | 12.09 | 12.18 | 12.33 | 12.48 | 12.57 | 12.72 |
| Pivot points | S3 | S2 | S1 | PP | R1 | R2 | R3 |
|---|---|---|---|---|---|---|---|
| Standard | 9.33 | 10.02 | 11.13 | 11.82 | 12.93 | 13.62 | 14.73 |
| Camarilla | 11.76 | 11.92 | 12.09 | 12.25 | 12.42 | 12.58 | 12.75 |
| Woodie | 9.55 | 10.13 | 11.35 | 11.93 | 13.15 | 13.73 | 14.95 |
| Fibonacci | 10.02 | 10.70 | 11.13 | 11.82 | 12.50 | 12.93 | 13.62 |
Numerical data
The following are the details of the technical indicators and moving averages that were collected to generate this technical analysis:
| RSI (14): | 72.80 | |
| MACD (12,26,9): | 0.3000 | |
| Directional Movement: | 18.95 | |
| AROON (14): | 100.00 | |
| DEMA (21): | 12.61 | |
| Parabolic SAR (0,02-0,02-0,2): | 12.14 | |
| Elder Ray (13): | 0.24 | |
| Super Trend (3,10): | 11.97 | |
| Zig ZAG (10): | 12.66 | |
| VORTEX (21): | 1.2800 | |
| Stochastique (14,3,5): | 90.16 | |
| TEMA (21): | 12.66 | |
| Williams %R (14): | -4.55 | |
| Chande Momentum Oscillator (20): | 0.47 | |
| Repulse (5,40,3): | 1.8600 | |
| ROCnROLL: | 1 | |
| TRIX (15,9): | 0.3900 | |
| Courbe Coppock: | 6.78 |
| MA7: | 12.44 | |
| MA20: | 12.28 | |
| MA50: | 11.55 | |
| MA100: | 11.02 | |
| MAexp7: | 12.48 | |
| MAexp20: | 12.20 | |
| MAexp50: | 11.70 | |
| MAexp100: | 11.27 | |
| Price / MA7: | +1.77% | |
| Price / MA20: | +3.09% | |
| Price / MA50: | +9.61% | |
| Price / MA100: | +14.88% | |
| Price / MAexp7: | +1.44% | |
| Price / MAexp20: | +3.77% | |
| Price / MAexp50: | +8.21% | |
| Price / MAexp100: | +12.33% |
News
The last news published on DT.PFANDBRIEFBK AG at the time of the generation of this analysis was as follows:
- DGAP-Adhoc: Deutsche Pfandbriefbank AG: pbb raises guidance for the full year 2019, to a pre-tax profit between EUR205 million and EUR215 million
- DGAP-Adhoc: Deutsche Pfandbriefbank AG: Trustee in Estate UK-3 securitization confirms that GBP 113.8 million loss allocation is permissible
- DGAP-Adhoc: Deutsche Pfandbriefbank AG: Expert in Estate UK-3 securitization finds loss allocation to credit linked notes in full amount of GBP 113.8 million permissible - therefore no negative impact on Deutsche Pfandbriefbank results
- DGAP-Adhoc: Deutsche Pfandbriefbank AG: pbb offers repurchase of unsecured benchmark bond
- DGAP-Adhoc: Deutsche Pfandbriefbank AG: pbb expected to pay its dividends without tax deduction for the next five to seven years
About author

Online


Add a comment
Comments
0 comments on the analysis DT.PFANDBRIEFBK AG - Daily