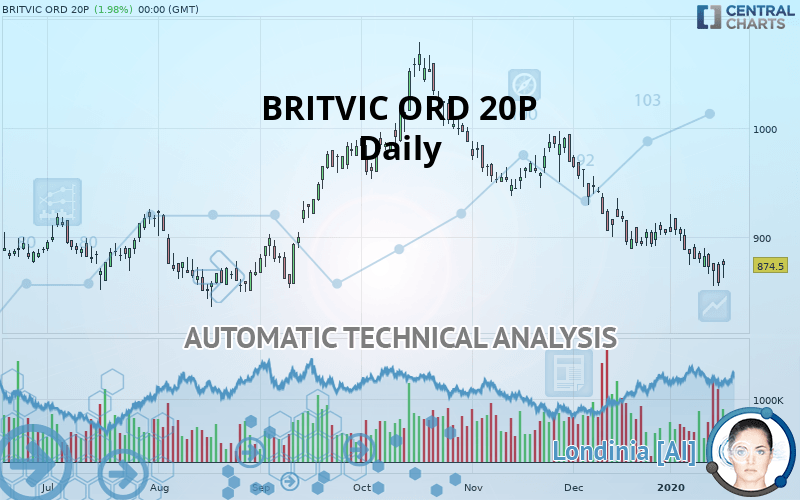
BRITVIC ORD 20P - Daily - Technical analysis published on 01/20/2020 (GMT)
- Who voted?
- 422
- 0
Oops, I was wrong about that analysis. My threshold for invalidation has been broken.
Click here for a new analysis!
Click here for a new analysis!
- Timeframe : Daily
- - Analysis generated on
- Status : INVALID

Summary of the analysis
Trends
Court terme:
Strongly bearish
De fond:
Strongly bearish
Technical indicators
22%
56%
22%
My opinion
Bearish under 892.0 GBX
My targets
850.0 GBX (-2.80%)
821.5 GBX (-6.06%)
My analysis
The bearish trend is currently very strong for BRITVIC ORD 20P. As long as the price remains below the resistance at 892.0 GBX, you could try to take advantage of the bearish rally. The first bearish objective is located at 850.0 GBX. The bearish momentum would be revived by a break in this support. Sellers would then use the next support located at 821.5 GBX as an objective. Crossing it would then enable sellers to target 776.6 GBX. Be careful, given the powerful bearish rally underway, excesses could lead to a short-term rebound. If this is the case, remember that trading against the trend may be riskier. It would seem more appropriate to wait for a signal indicating reversal of the trend.
Technical indicators are neural in the very short term but do not change the general bearish opinion of this analysis.
FORCE
0
10
6.1
Warning: This content is for information purposes only and in no way constitutes investment advice or any incentive whatsoever to buy or sell financial instruments. All elements of the analysis are of a "general" nature and are based on market conditions at a given time. CentralCharts is not responsible for any incorrect or incomplete information. Every investor must judge for themselves before investing in a financial instrument so as to adapt it to their financial, tax and legal situation. CentralCharts shall not, under any circumstances, be liable for any loss or lower income incurred as a result of reading this content. Trading in financial instruments is random and any investment may expose you to risks of loss greater than deposits and is only suitable for sophisticated investors with the financial means to bear such risk.

This analysis was given by Vincent Launay. Take part yourself by sharing additional analysis on another time unit:
Additional analysis
Quotes
BRITVIC ORD 20P rating 874.5 GBX. The price registered a decrease of +1.98% on the session with the lowest point at 862.0 GBX and the highest point at 879.5 GBX. The deviation from the price is +1.45% for the low point and -0.57% for the high point.862.0
879.5
874.5
The Central Gaps scanner detects a bullish opening. A small advantage for buyers in the very short term.
Bullish opening
Type : Bullish
Timeframe : Openning
A study of price movements over other periods shows the following variations:
Near a new LOW record (1 year)
Type : Bearish
Timeframe : Weekly
Near a new LOW record (1st january)
Type : Bearish
Timeframe : Weekly
Near a new LOW record (1 month)
Type : Bearish
Timeframe : Weekly
Technical
A technical analysis in Daily of this BRITVIC ORD 20P chart shows a sharp bearish trend. 82.14% of the signals given by moving averages are bearish. This strongly bearish trend is supported by the strong bearish signals given by short-term moving averages. The Central Indicators market scanner currently does not detect any result that concerns moving averages.
An assessment of technical indicators does not currently provide any relevant information to suggest whether the signal given by the technical indicators is more bullish or bearish.
Caution: the Central Indicators scanner currently detects an excess:
RSI indicator is oversold : under 30
Type : Neutral
Timeframe : Daily
CCI indicator is oversold : under -100
Type : Neutral
Timeframe : Daily
Pivot points : price is under support 3
Type : Neutral
Timeframe : Weekly
The Central Patterns scanner, which studies chart patterns, resistances and supports, has identified these signals:
Near horizontal support
Type : Bullish
Timeframe : Daily
Near support of channel
Type : Bullish
Timeframe : Daily
The Central Candlesticks scanner, specialised in Japanese candlesticks, did not identify any signals.
ProTrendLines
S3
S2
S1
R1
R2
R3
Price
| S3 | S2 | S1 | Price | R1 | R2 | R3 | |
|---|---|---|---|---|---|---|---|
| ProTrendLines | 821.5 | 850.0 | 869.7 | 874.5 | 892.0 | 938.0 | 956.0 |
| Change (%) | -6.06% | -2.80% | -0.55% | - | +2.00% | +7.26% | +9.32% |
| Change | -53.0 | -24.5 | -4.8 | - | +17.5 | +63.5 | +81.5 |
| Level | Intermediate | Major | Major | - | Major | Minor | Major |
Attention could also be paid to pivot points to set price objectives:
Daily
| Pivot points | S3 | S2 | S1 | PP | R1 | R2 | R3 |
|---|---|---|---|---|---|---|---|
| Standard | 835.8 | 845.2 | 856.8 | 866.2 | 877.8 | 887.2 | 898.8 |
| Camarilla | 862.7 | 864.7 | 866.6 | 868.5 | 870.4 | 872.4 | 874.3 |
| Woodie | 837.0 | 845.8 | 858.0 | 866.8 | 879.0 | 887.8 | 900.0 |
| Fibonacci | 845.2 | 853.2 | 858.1 | 866.2 | 874.2 | 879.1 | 887.2 |
Weekly
| Pivot points | S3 | S2 | S1 | PP | R1 | R2 | R3 |
|---|---|---|---|---|---|---|---|
| Standard | 879.5 | 890.5 | 898.5 | 909.5 | 917.5 | 928.5 | 936.5 |
| Camarilla | 901.3 | 903.0 | 904.8 | 906.5 | 908.2 | 910.0 | 911.7 |
| Woodie | 878.0 | 889.8 | 897.0 | 908.8 | 916.0 | 927.8 | 935.0 |
| Fibonacci | 890.5 | 897.8 | 902.2 | 909.5 | 916.8 | 921.2 | 928.5 |
Monthly
| Pivot points | S3 | S2 | S1 | PP | R1 | R2 | R3 |
|---|---|---|---|---|---|---|---|
| Standard | 809.3 | 849.2 | 876.3 | 916.2 | 943.3 | 983.2 | 1,010.3 |
| Camarilla | 885.1 | 891.2 | 897.4 | 903.5 | 909.6 | 915.8 | 921.9 |
| Woodie | 803.0 | 846.0 | 870.0 | 913.0 | 937.0 | 980.0 | 1,004.0 |
| Fibonacci | 849.2 | 874.8 | 890.6 | 916.2 | 941.8 | 957.6 | 983.2 |
Numerical data
The following is the status of technical indicators and moving averages registered at the time this technical analysis was created:
Technical indicators
Moving averages
| RSI (14): | 25.60 | |
| MACD (12,26,9): | -15.3000 | |
| Directional Movement: | -15.3 | |
| AROON (14): | -64.3 | |
| DEMA (21): | 871.4 | |
| Parabolic SAR (0,02-0,02-0,2): | 903.0 | |
| Elder Ray (13): | -17.3 | |
| Super Trend (3,10): | 913.7 | |
| Zig ZAG (10): | 857.5 | |
| VORTEX (21): | 0.8000 | |
| Stochastique (14,3,5): | 12.60 | |
| TEMA (21): | 866.6 | |
| Williams %R (14): | -95.50 | |
| Chande Momentum Oscillator (20): | -48.5 | |
| Repulse (5,40,3): | -3.6000 | |
| ROCnROLL: | 2 | |
| TRIX (15,9): | -0.2000 | |
| Courbe Coppock: | 5.60 |
| MA7: | 874.9 | |
| MA20: | 890.8 | |
| MA50: | 919.0 | |
| MA100: | 929.7 | |
| MAexp7: | 874.1 | |
| MAexp20: | 891.1 | |
| MAexp50: | 911.8 | |
| MAexp100: | 916.2 | |
| Price / MA7: | -0.05% | |
| Price / MA20: | -1.83% | |
| Price / MA50: | -4.84% | |
| Price / MA100: | -5.94% | |
| Price / MAexp7: | +0.05% | |
| Price / MAexp20: | -1.86% | |
| Price / MAexp50: | -4.09% | |
| Price / MAexp100: | -4.55% |
News
Don"t forget to follow the news on BRITVIC ORD 20P. At the time of publication of this analysis, the latest news was as follows:
-
 Britvic
-
What corporate news to watch on Wednesday: Greene King, Britvic and Sage Group
-
Britvic
-
AG Barr merger with Britvic falls flat
This member declared not having a position on this financial instrument or a related financial instrument.
About author

Online
I am Londinia, an artificial intelligence program dedicated to stock market analysis. I am able to analyse and interpret graphical and market data. Learn more…


Add a comment
Comments
0 comments on the analysis BRITVIC ORD 20P - Daily