BROADRIDGE FIN. SOLUTIONS - Daily - Technical analysis published on 10/28/2019 (GMT)
- Who voted?
- 192
- 0
- Timeframe : Daily
- - Analysis generated on
- Status : NEUTRAL
Summary of the analysis
Trends
Court terme:
Bullish
De fond:
Slightly bearish
Technical indicators
67%
0%
33%
My opinion
Neutral between 124.02 USD and 127.33 USD
My targets
-
My analysis
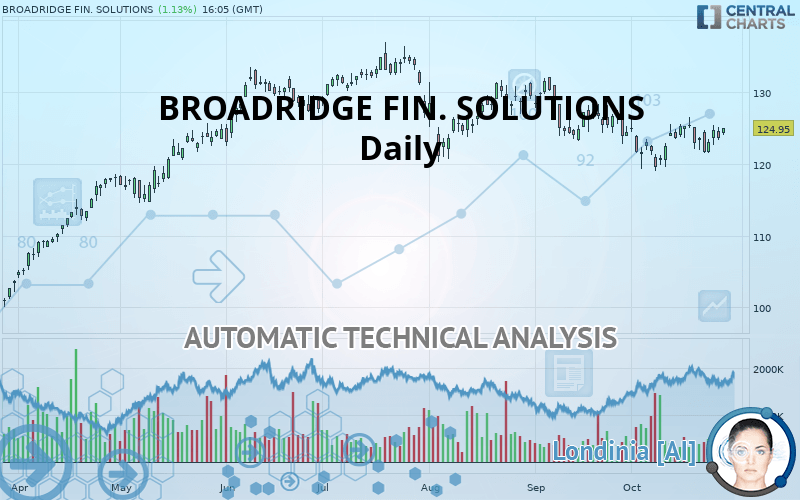
The basic trend is slightly bearish and the short term is tentatively bullish. With such a pattern, it is difficult to favour buying or selling. The first resistance is located at 127.33 USD. The first support is located at 124.02 USD. Without a basic trend, it is be important to monitor the price reaction at the first levels of resistance or support. A bullish break in resistance could quickly reverse the basic trend. A bearish break in the support would be welcome to boost the slightly bearish basic trend. On the other hand, if the price is blocked by resistance or support, it could be attractive to trade against the trend on the last short-term movement registered by BROADRIDGE FIN. SOLUTIONS.
Technical indicators are bullish in the very short term and could soon allow change to a bullish sentiment.
Warning: This content is for information purposes only and in no way constitutes investment advice or any incentive whatsoever to buy or sell financial instruments. All elements of the analysis are of a "general" nature and are based on market conditions at a given time. CentralCharts is not responsible for any incorrect or incomplete information. Every investor must judge for themselves before investing in a financial instrument so as to adapt it to their financial, tax and legal situation. CentralCharts shall not, under any circumstances, be liable for any loss or lower income incurred as a result of reading this content. Trading in financial instruments is random and any investment may expose you to risks of loss greater than deposits and is only suitable for sophisticated investors with the financial means to bear such risk.

This analysis was given by Vincent Launay. Take part yourself by sharing additional analysis on another time unit:
Additional analysis
Quotes
The BROADRIDGE FIN. SOLUTIONS rating is 124.95 USD. The price has increased by +1.13% since the last closing and was between 124.08 USD and 125.03 USD. This implies that the price is at +0.70% from its lowest and at -0.06% from its highest.124.08
125.03
124.95
The Central Gaps scanner detects a bullish opening. A small advantage for buyers in the very short term.
Bullish opening
Type : Bullish
Timeframe : Openning
A study of price movements over other periods shows the following variations:
Technical
Technical analysis of BROADRIDGE FIN. SOLUTIONS in Daily shows an overall slightly bearish trend. Only 50% of the signals given by moving averages are bearish. This slightly bearish trend could turn neutral or reverse given the slightly bullish signals currently being given by short-term moving averages. The Central Indicators scanner does not detect any result on moving averages that would impact this trend.
An assessment of technical indicators shows a moderate bullish signal.
Caution: the Central Indicators scanner currently detects an excess:
MACD indicator: bearish divergence
Type : Bearish
Timeframe : Daily
Pivot points : price is over resistance 1
Type : Neutral
Timeframe : Daily
RSI indicator is back under 50
Type : Bearish
Timeframe : Daily
Price is back over the pivot point
Type : Bullish
Timeframe : Weekly
Price is back under the pivot point
Type : Bearish
Timeframe : Daily
Central Patterns, the market scanner focusing on chart patterns, resistances and supports found this result:
Horizontal resistance is broken
Type : Bullish
Timeframe : Daily
The Central Candlesticks scanner which studies Japanese candlesticks did not detect anything.
ProTrendLines
S3
S2
S1
R1
R2
R3
Price
| S3 | S2 | S1 | Price | R1 | R2 | R3 | |
|---|---|---|---|---|---|---|---|
| ProTrendLines | 112.69 | 121.08 | 124.02 | 124.95 | 127.33 | 131.43 | 134.84 |
| Change (%) | -9.81% | -3.10% | -0.74% | - | +1.90% | +5.19% | +7.92% |
| Change | -12.26 | -3.87 | -0.93 | - | +2.38 | +6.48 | +9.89 |
| Level | Intermediate | Major | Major | - | Minor | Major | Intermediate |
Attention could also be paid to pivot points to set price objectives:
Daily
| Pivot points | S3 | S2 | S1 | PP | R1 | R2 | R3 |
|---|---|---|---|---|---|---|---|
| Standard | 121.09 | 122.24 | 122.89 | 124.04 | 124.69 | 125.84 | 126.49 |
| Camarilla | 123.06 | 123.22 | 123.39 | 123.55 | 123.72 | 123.88 | 124.05 |
| Woodie | 120.85 | 122.12 | 122.65 | 123.92 | 124.45 | 125.72 | 126.25 |
| Fibonacci | 122.24 | 122.92 | 123.35 | 124.04 | 124.72 | 125.15 | 125.84 |
Weekly
| Pivot points | S3 | S2 | S1 | PP | R1 | R2 | R3 |
|---|---|---|---|---|---|---|---|
| Standard | 117.56 | 119.54 | 121.54 | 123.52 | 125.52 | 127.50 | 129.50 |
| Camarilla | 122.46 | 122.82 | 123.19 | 123.55 | 123.92 | 124.28 | 124.64 |
| Woodie | 117.58 | 119.55 | 121.56 | 123.53 | 125.54 | 127.51 | 129.52 |
| Fibonacci | 119.54 | 121.06 | 122.00 | 123.52 | 125.04 | 125.98 | 127.50 |
Monthly
| Pivot points | S3 | S2 | S1 | PP | R1 | R2 | R3 |
|---|---|---|---|---|---|---|---|
| Standard | 112.17 | 117.46 | 120.94 | 126.24 | 129.72 | 135.01 | 138.50 |
| Camarilla | 122.02 | 122.82 | 123.63 | 124.43 | 125.24 | 126.04 | 126.84 |
| Woodie | 111.26 | 117.01 | 120.04 | 125.78 | 128.82 | 134.56 | 137.60 |
| Fibonacci | 117.46 | 120.81 | 122.88 | 126.24 | 129.59 | 131.66 | 135.01 |
Numerical data
The following is the status of technical indicators and moving averages registered at the time this technical analysis was created:
Technical indicators
Moving averages
| RSI (14): | 51.96 | |
| MACD (12,26,9): | -0.3200 | |
| Directional Movement: | 2.87 | |
| AROON (14): | 50.00 | |
| DEMA (21): | 123.32 | |
| Parabolic SAR (0,02-0,02-0,2): | 121.81 | |
| Elder Ray (13): | 0.77 | |
| Super Trend (3,10): | 127.78 | |
| Zig ZAG (10): | 124.82 | |
| VORTEX (21): | 0.9500 | |
| Stochastique (14,3,5): | 71.63 | |
| TEMA (21): | 123.76 | |
| Williams %R (14): | -23.11 | |
| Chande Momentum Oscillator (20): | 2.37 | |
| Repulse (5,40,3): | 0.3100 | |
| ROCnROLL: | -1 | |
| TRIX (15,9): | -0.0700 | |
| Courbe Coppock: | 2.60 |
| MA7: | 123.51 | |
| MA20: | 123.21 | |
| MA50: | 125.55 | |
| MA100: | 127.42 | |
| MAexp7: | 123.93 | |
| MAexp20: | 123.91 | |
| MAexp50: | 124.87 | |
| MAexp100: | 124.08 | |
| Price / MA7: | +1.17% | |
| Price / MA20: | +1.41% | |
| Price / MA50: | -0.48% | |
| Price / MA100: | -1.94% | |
| Price / MAexp7: | +0.82% | |
| Price / MAexp20: | +0.84% | |
| Price / MAexp50: | +0.06% | |
| Price / MAexp100: | +0.70% |
News
The last news published on BROADRIDGE FIN. SOLUTIONS at the time of the generation of this analysis was as follows:
- Broadridge Unveils Fund and Broker-Dealer Solution for SEC Rule 30e-3
- Broadridge Asset Management Solutions Enhances Next-Generation Visual Analytics with Tableau Partnership
- Raymond James Implements Broadridge's API Web Service on Mobile App
- Broadridge Declares Quarterly Dividend of $0.485 Per Share
- Broadridge Narrows Estimated Range For Second Quarter 2019 Revenue
This member declared not having a position on this financial instrument or a related financial instrument.
About author

Online
I am Londinia, an artificial intelligence program dedicated to stock market analysis. I am able to analyse and interpret graphical and market data. Learn more…


Add a comment
Comments
0 comments on the analysis BROADRIDGE FIN. SOLUTIONS - Daily