BROOKS AUTOMATION INC. - Daily - Technical analysis published on 07/29/2019 (GMT)
- Who voted?
- 214
- 0
Click here for a new analysis!
- Timeframe : Daily
- - Analysis generated on
- Status : INVALID
Summary of the analysis
Additional analysis
Quotes
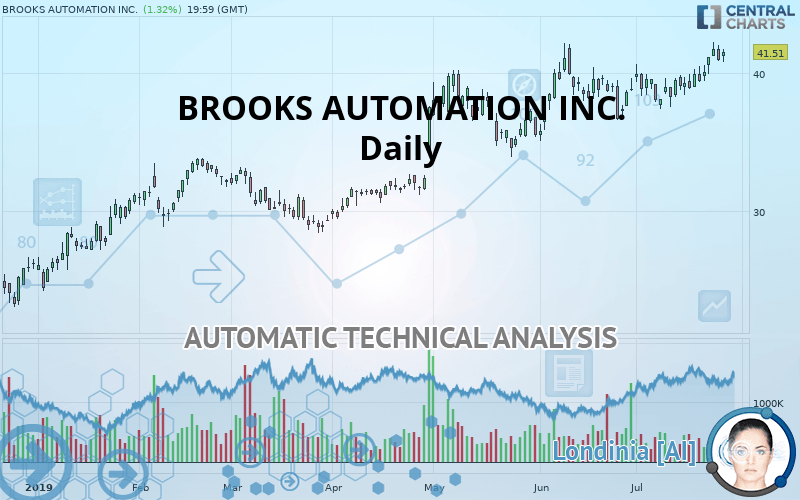
BROOKS AUTOMATION INC. rating 41.51 USD. The price registered an increase of +1.32% on the session with the lowest point at 40.82 USD and the highest point at 41.77 USD. The deviation from the price is +1.69% for the low point and -0.62% for the high point.The Central Gaps scanner detects a bullish opening. A small advantage for buyers in the very short term.
Bullish opening
Type : Bullish
Timeframe : Openning
So that you have an overall view of the price change, here is a table showing the variations over several periods:
New HIGH record (5 years)
Type : Bullish
Timeframe : Weekly
Near a new HIGH record (1 year)
Type : Bullish
Timeframe : Weekly
Near a new HIGH record (1st january)
Type : Bullish
Timeframe : Weekly
Near a new HIGH record (1 month)
Type : Bullish
Timeframe : Weekly
Technical
A technical analysis in Daily of this BROOKS AUTOMATION INC. chart shows a strongly bullish trend. 92.86% of the signals given by moving averages are bullish. The overall trend is supported by the strong bullish signals from short-term moving averages. There is no crossing of moving average by the price or crossing of moving averages between themselves.
An assessment of technical indicators shows a strong bullish signal.
Caution: the Central Indicators scanner currently detects an excess:
CCI indicator is overbought : over 100
Type : Neutral
Timeframe : Daily
Previous candle closed over Bollinger bands
Type : Neutral
Timeframe : Daily
Williams %R indicator is overbought : over -20
Type : Neutral
Timeframe : Daily
Pivot points : price is over resistance 1
Type : Neutral
Timeframe : Weekly
Price is back under the pivot point
Type : Bearish
Timeframe : Daily
Price is back under the pivot point
Type : Bearish
Timeframe : Weekly
An analysis of the price chart with the Central Patterns scanner (detector of chart patterns and resistances and supports) shows a result that can have an impact on the price change:
Resistance of channel is broken
Type : Bullish
Timeframe : Daily
From the Japanese candlestick perspective, the Central Candlesticks scanner notes the presence of these results that could impact the short-term trend:
Black evening star
Type : Bearish
Timeframe : Daily
Upside Tasuki gap
Type : Bullish
Timeframe : Daily
| S3 | S2 | S1 | Price | |
|---|---|---|---|---|
| ProTrendLines | 27.60 | 34.39 | 39.60 | 41.51 |
| Change (%) | -33.51% | -17.15% | -4.60% | - |
| Change | -13.91 | -7.12 | -1.91 | - |
| Level | Major | Major | Major | - |
Pivot points can also be used to set your price objectives. Here is the price situation in relation to pivot points:
| Pivot points | S3 | S2 | S1 | PP | R1 | R2 | R3 |
|---|---|---|---|---|---|---|---|
| Standard | 39.45 | 40.17 | 40.57 | 41.28 | 41.69 | 42.40 | 42.80 |
| Camarilla | 40.66 | 40.77 | 40.87 | 40.97 | 41.07 | 41.18 | 41.28 |
| Woodie | 39.30 | 40.09 | 40.41 | 41.21 | 41.53 | 42.32 | 42.65 |
| Fibonacci | 40.17 | 40.59 | 40.86 | 41.28 | 41.71 | 41.98 | 42.40 |
| Pivot points | S3 | S2 | S1 | PP | R1 | R2 | R3 |
|---|---|---|---|---|---|---|---|
| Standard | 36.33 | 37.37 | 38.41 | 39.45 | 40.49 | 41.53 | 42.57 |
| Camarilla | 38.87 | 39.06 | 39.25 | 39.44 | 39.63 | 39.82 | 40.01 |
| Woodie | 36.32 | 37.37 | 38.40 | 39.45 | 40.48 | 41.53 | 42.56 |
| Fibonacci | 37.37 | 38.17 | 38.66 | 39.45 | 40.25 | 40.74 | 41.53 |
| Pivot points | S3 | S2 | S1 | PP | R1 | R2 | R3 |
|---|---|---|---|---|---|---|---|
| Standard | 27.92 | 31.46 | 35.10 | 38.64 | 42.28 | 45.82 | 49.46 |
| Camarilla | 36.78 | 37.43 | 38.09 | 38.75 | 39.41 | 40.07 | 40.73 |
| Woodie | 27.98 | 31.49 | 35.16 | 38.67 | 42.34 | 45.85 | 49.52 |
| Fibonacci | 31.46 | 34.20 | 35.89 | 38.64 | 41.38 | 43.07 | 45.82 |
Numerical data
The following is the status of technical indicators and moving averages registered at the time this technical analysis was created:
| RSI (14): | 60.50 | |
| MACD (12,26,9): | 0.7700 | |
| Directional Movement: | 10.37 | |
| AROON (14): | 78.57 | |
| DEMA (21): | 40.74 | |
| Parabolic SAR (0,02-0,02-0,2): | 37.47 | |
| Elder Ray (13): | 1.09 | |
| Super Trend (3,10): | 37.94 | |
| Zig ZAG (10): | 41.51 | |
| VORTEX (21): | 1.0800 | |
| Stochastique (14,3,5): | 82.74 | |
| TEMA (21): | 40.95 | |
| Williams %R (14): | -15.20 | |
| Chande Momentum Oscillator (20): | 2.56 | |
| Repulse (5,40,3): | 0.4900 | |
| ROCnROLL: | 1 | |
| TRIX (15,9): | 0.1900 | |
| Courbe Coppock: | 9.85 |
| MA7: | 40.69 | |
| MA20: | 39.58 | |
| MA50: | 38.46 | |
| MA100: | 35.50 | |
| MAexp7: | 40.76 | |
| MAexp20: | 39.80 | |
| MAexp50: | 38.39 | |
| MAexp100: | 36.34 | |
| Price / MA7: | +2.02% | |
| Price / MA20: | +4.88% | |
| Price / MA50: | +7.93% | |
| Price / MA100: | +16.93% | |
| Price / MAexp7: | +1.84% | |
| Price / MAexp20: | +4.30% | |
| Price / MAexp50: | +8.13% | |
| Price / MAexp100: | +14.23% |
News
The latest news and videos published on BROOKS AUTOMATION INC. at the time of the analysis were as follows:
- Brooks Automation Announces Third Quarter Fiscal 2019 Earnings Release Date and Conference Call
- Brooks Automation to Participate in the 11th Annual CEO Investor Summit 2019
- Brooks to Participate in Two Upcoming Investor Conferences
- Brooks to Participate in Three Upcoming Investor Conferences
- Brooks Automation Reports Results of Second Fiscal Quarter of 2019, Ended March 31, 2019, and Announces Quarterly Cash Dividend
About author

Online


Add a comment
Comments
0 comments on the analysis BROOKS AUTOMATION INC. - Daily