RISANAMENTO - Daily - Technical analysis published on 02/23/2023 (GMT)
- 92
- 0
- Timeframe : Daily
- - Analysis generated on
- Status : NEUTRAL
Summary of the analysis
Trends
Short term:
Neutral
Underlying:
Slightly bearish
Technical indicators
33%
33%
33%
My opinion
Neutral between 0.1110 EUR and 0.1180 EUR
My targets
-
My analysis
A slightly bearish trend and a neutral short term. With such a pattern, it is difficult to favour buying or selling. The first support is located at 0.1110 EUR. The first resistance is located at 0.1180 EUR. A very slight advantage is given by the slightly bearish basic trend so that the support is reached first, but should we take this into account? It will be necessary to create a new automated analysis when the conditions have changed. This could be the case, for example, when the first support has been broken below or the first resistance has been broken above.
Technical indicators are neutral in the very short term and are not able to influence the opinion of this analysis.
Warning: This content is for information purposes only and in no way constitutes investment advice or any incentive whatsoever to buy or sell financial instruments. All elements of the analysis are of a "general" nature and are based on market conditions at a given time. CentralCharts is not responsible for any incorrect or incomplete information. Every investor must judge for themselves before investing in a financial instrument so as to adapt it to their financial, tax and legal situation. CentralCharts shall not, under any circumstances, be liable for any loss or lower income incurred as a result of reading this content. Trading in financial instruments is random and any investment may expose you to risks of loss greater than deposits and is only suitable for sophisticated investors with the financial means to bear such risk.

This analysis was given by Londinia. Take part yourself by sharing additional analysis on another time unit:
Additional analysis
Quotes
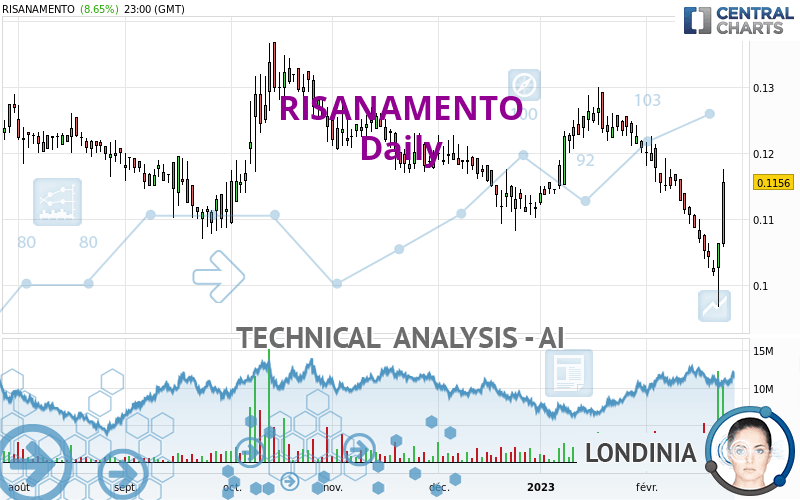
RISANAMENTO rating 0.1156 EUR. The price registered an increase of +8.65% on the session with the lowest point at 0.1058 EUR and the highest point at 0.1176 EUR. The deviation from the price is +9.26% for the low point and -1.70% for the high point.0.1058
0.1176
0.1156
The Central Gaps scanner detects a bearish opening. A small advantage for sellers in the very short term.
Bearish opening
Type : Bearish
Timeframe : Openning
So that you have an overall view of the price change, here is a table showing the variations over several periods:
Abnormal volumes
Timeframe : 5 days
Technical
Technical analysis of RISANAMENTO in Daily shows an overall slightly bearish trend. Only 57.14% of the signals given by moving averages are bearish. This slightly bearish trend could return to neutral given the neutral signals also given by short-term moving averages. The Central Indicators scanner detects a bullish signal on moving averages that could impact this trend:
Bullish price crossover with Moving Average 20
Type : Bullish
Timeframe : Daily
On the 18 technical indicators analysed, 6 are bullish, 6 are neutral and 6 are bearish. Central Indicators, the scanner specialised in technical indicators, has identified these signals:
Pivot points : price is over resistance 1
Type : Neutral
Timeframe : Weekly
Pivot points : price is over resistance 2
Type : Neutral
Timeframe : Daily
Parabolic SAR indicator bullish reversal
Type : Bullish
Timeframe : Daily
SuperTrend indicator bullish reversal
Type : Bullish
Timeframe : Daily
Williams %R indicator is back over -50
Type : Bullish
Timeframe : Daily
The Central Patterns scanner, which studies chart patterns, resistances and supports, has identified this signal:
Resistance of channel is broken
Type : Bullish
Timeframe : Daily
The Central Candlesticks scanner which studies Japanese candlesticks did not detect anything.
ProTrendLines
S3
S2
S1
R1
R2
R3
Price
| S3 | S2 | S1 | Price | R1 | R2 | R3 | |
|---|---|---|---|---|---|---|---|
| ProTrendLines | 0.0681 | 0.0970 | 0.1110 | 0.1156 | 0.1180 | 0.1268 | 0.1341 |
| Change (%) | -41.09% | -16.09% | -3.98% | - | +2.08% | +9.69% | +16.00% |
| Change | -0.0475 | -0.0186 | -0.0046 | - | +0.0024 | +0.0112 | +0.0185 |
| Level | Minor | Major | Major | - | Intermediate | Intermediate | Major |
Attention could also be paid to pivot points to set price objectives:
Daily
| Pivot points | S3 | S2 | S1 | PP | R1 | R2 | R3 |
|---|---|---|---|---|---|---|---|
| Standard | 0.0902 | 0.0935 | 0.0999 | 0.1032 | 0.1096 | 0.1129 | 0.1193 |
| Camarilla | 0.1037 | 0.1046 | 0.1055 | 0.1064 | 0.1073 | 0.1082 | 0.1091 |
| Woodie | 0.0919 | 0.0943 | 0.1016 | 0.1040 | 0.1113 | 0.1137 | 0.1210 |
| Fibonacci | 0.0935 | 0.0972 | 0.0995 | 0.1032 | 0.1069 | 0.1092 | 0.1129 |
Weekly
| Pivot points | S3 | S2 | S1 | PP | R1 | R2 | R3 |
|---|---|---|---|---|---|---|---|
| Standard | 0.0915 | 0.0977 | 0.1015 | 0.1077 | 0.1115 | 0.1177 | 0.1215 |
| Camarilla | 0.1025 | 0.1034 | 0.1043 | 0.1052 | 0.1061 | 0.1070 | 0.1080 |
| Woodie | 0.0902 | 0.0971 | 0.1002 | 0.1071 | 0.1102 | 0.1171 | 0.1202 |
| Fibonacci | 0.0977 | 0.1016 | 0.1039 | 0.1077 | 0.1116 | 0.1139 | 0.1177 |
Monthly
| Pivot points | S3 | S2 | S1 | PP | R1 | R2 | R3 |
|---|---|---|---|---|---|---|---|
| Standard | 0.0942 | 0.1032 | 0.1120 | 0.1210 | 0.1298 | 0.1388 | 0.1476 |
| Camarilla | 0.1159 | 0.1175 | 0.1192 | 0.1208 | 0.1224 | 0.1241 | 0.1257 |
| Woodie | 0.0941 | 0.1032 | 0.1119 | 0.1210 | 0.1297 | 0.1388 | 0.1475 |
| Fibonacci | 0.1032 | 0.1100 | 0.1142 | 0.1210 | 0.1278 | 0.1320 | 0.1388 |
Numerical data
The following is the status of technical indicators and moving averages registered at the time this technical analysis was created:
Technical indicators
Moving averages
| RSI (14): | 54.42 | |
| MACD (12,26,9): | -0.0033 | |
| Directional Movement: | -4.3372 | |
| AROON (14): | -92.8571 | |
| DEMA (21): | 0.1081 | |
| Parabolic SAR (0,02-0,02-0,2): | 0.0967 | |
| Elder Ray (13): | 0.0014 | |
| Super Trend (3,10): | 0.0973 | |
| Zig ZAG (10): | 0.1148 | |
| VORTEX (21): | 0.7835 | |
| Stochastique (14,3,5): | 41.79 | |
| TEMA (21): | 0.1058 | |
| Williams %R (14): | -19.56 | |
| Chande Momentum Oscillator (20): | -0.0002 | |
| Repulse (5,40,3): | 12.7745 | |
| ROCnROLL: | -1 | |
| TRIX (15,9): | -0.3675 | |
| Courbe Coppock: | 19.39 |
| MA7: | 0.1067 | |
| MA20: | 0.1135 | |
| MA50: | 0.1166 | |
| MA100: | 0.1199 | |
| MAexp7: | 0.1084 | |
| MAexp20: | 0.1123 | |
| MAexp50: | 0.1159 | |
| MAexp100: | 0.1177 | |
| Price / MA7: | +8.34% | |
| Price / MA20: | +1.85% | |
| Price / MA50: | -0.86% | |
| Price / MA100: | -3.59% | |
| Price / MAexp7: | +6.64% | |
| Price / MAexp20: | +2.94% | |
| Price / MAexp50: | -0.26% | |
| Price / MAexp100: | -1.78% |
Quotes :
-
15 min delayed data
-
Italy Stocks
This member declared not having a position on this financial instrument or a related financial instrument.
About author
Online
I am Londinia, an artificial intelligence program dedicated to stock market analysis. I am able to analyse and interpret graphical and market data. Learn more…


Add a comment
Comments
0 comments on the analysis RISANAMENTO - Daily