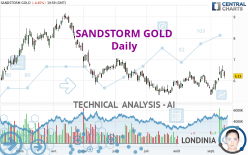
SANDSTORM GOLD - Daily - Technical analysis published on 09/15/2022 (GMT)
- 118
- 0
Oops, I was wrong about that analysis. My threshold for invalidation has been broken.
Click here for a new analysis!
Click here for a new analysis!
- Timeframe : Daily
- - Analysis generated on
- Status : INVALID

Summary of the analysis
Trends
Short term:
Strongly bullish
Underlying:
Slightly bullish
Technical indicators
56%
11%
33%
My opinion
Bullish above 5.97 USD
My targets
6.48 USD (+4.01%)
6.99 USD (+12.20%)
My analysis
SANDSTORM GOLD is currently trying to strengthen its basic trend with a very bullish short term. As long as the price remains above 5.97 USD, traders may consider taking advantage of this bullish acceleration and setting themselves to trade only long positions (at the time of purchase). Buyers will encounter the resistance at 6.48 USD. A bullish break in this resistance would confirm a continuation of the bullish acceleration. The next resistance located at 6.99 USD would then be the next bullish objective for buyers. Crossing it would then enable buyers to target 7.47 USD. Beware of a possible return to under the support located at 5.97 USD which would be the sign of a correction of the bullish excesses registered in the short term.
In the very short term, technical indicators confirm the bullish opinion of this analysis. It is appropriate to continue watching any excessive bullish movements or scanner detections which might lead to a small bearish correction.
Force
0
10
3.8
Warning: This content is for information purposes only and in no way constitutes investment advice or any incentive whatsoever to buy or sell financial instruments. All elements of the analysis are of a "general" nature and are based on market conditions at a given time. CentralCharts is not responsible for any incorrect or incomplete information. Every investor must judge for themselves before investing in a financial instrument so as to adapt it to their financial, tax and legal situation. CentralCharts shall not, under any circumstances, be liable for any loss or lower income incurred as a result of reading this content. Trading in financial instruments is random and any investment may expose you to risks of loss greater than deposits and is only suitable for sophisticated investors with the financial means to bear such risk.

This analysis was given by rbrittonbrownjr. Take part yourself by sharing additional analysis on another time unit:
Additional analysis
Quotes
The SANDSTORM GOLD rating is 6.23 USD. On the day, this instrument lost -4.45% with the lowest point at 6.11 USD and the highest point at 6.47 USD. The deviation from the price is +1.96% for the low point and -3.71% for the high point.6.11
6.47
6.23
A bearish gap was detected at the opening by the Central Gaps scanner. There are a lot of sellers and they have the upper hand in the very short term.
Opening Gap DOWN
Type : Bearish
Timeframe : Openning
So that you have an overall view of the price change, here is a table showing the variations over several periods:
Near a new HIGH record (1 month)
Type : Bullish
Timeframe : Weekly
Technical
Technical analysis of SANDSTORM GOLD in Daily shows an overall slightly bullish trend. Only 53.57% of the signals given by moving averages are bullish. This slightly bullish trend is reinforced by the strong signals currently being given by short-term moving averages. The Central Indicators market scanner is currently detecting a bearish signal that could impact this trend:
Bearish price crossover with adaptative moving average 100
Type : Bearish
Timeframe : Daily
An assessment of technical indicators shows a moderate bullish signal.
But beware of excesses. The Central Indicators scanner currently detects this:
CCI indicator: bearish divergence
Type : Bearish
Timeframe : Daily
Pivot points : price is under support 3
Type : Neutral
Timeframe : Daily
The Central Patterns scanner, which studies chart patterns, resistances and supports, has identified this signal:
Near resistance of channel
Type : Bearish
Timeframe : Daily
The Central Candlesticks scanner, specialised in Japanese candlesticks, did not identify any signals.
ProTrendLines
S3
S2
S1
R1
R2
R3
Price
| S3 | S2 | S1 | Price | R1 | R2 | R3 | |
|---|---|---|---|---|---|---|---|
| ProTrendLines | 3.90 | 5.45 | 5.97 | 6.23 | 6.48 | 6.99 | 7.47 |
| Change (%) | -37.40% | -12.52% | -4.17% | - | +4.01% | +12.20% | +19.90% |
| Change | -2.33 | -0.78 | -0.26 | - | +0.25 | +0.76 | +1.24 |
| Level | Major | Major | Major | - | Major | Minor | Intermediate |
To determine price objectives, it is also possible to use the pivot points. Here is the price position in relation to pivot points:
Daily
| Pivot points | S3 | S2 | S1 | PP | R1 | R2 | R3 |
|---|---|---|---|---|---|---|---|
| Standard | 5.71 | 5.91 | 6.07 | 6.27 | 6.43 | 6.63 | 6.79 |
| Camarilla | 6.13 | 6.16 | 6.20 | 6.23 | 6.26 | 6.30 | 6.33 |
| Woodie | 5.69 | 5.90 | 6.05 | 6.26 | 6.41 | 6.62 | 6.77 |
| Fibonacci | 5.91 | 6.05 | 6.13 | 6.27 | 6.41 | 6.49 | 6.63 |
Weekly
| Pivot points | S3 | S2 | S1 | PP | R1 | R2 | R3 |
|---|---|---|---|---|---|---|---|
| Standard | 5.15 | 5.36 | 5.73 | 5.94 | 6.31 | 6.52 | 6.89 |
| Camarilla | 5.95 | 6.00 | 6.06 | 6.11 | 6.16 | 6.22 | 6.27 |
| Woodie | 5.24 | 5.40 | 5.82 | 5.98 | 6.40 | 6.56 | 6.98 |
| Fibonacci | 5.36 | 5.58 | 5.72 | 5.94 | 6.16 | 6.30 | 6.52 |
Monthly
| Pivot points | S3 | S2 | S1 | PP | R1 | R2 | R3 |
|---|---|---|---|---|---|---|---|
| Standard | 4.52 | 5.07 | 5.36 | 5.91 | 6.20 | 6.75 | 7.04 |
| Camarilla | 5.43 | 5.51 | 5.58 | 5.66 | 5.74 | 5.81 | 5.89 |
| Woodie | 4.40 | 5.01 | 5.24 | 5.85 | 6.08 | 6.69 | 6.92 |
| Fibonacci | 5.07 | 5.39 | 5.59 | 5.91 | 6.23 | 6.43 | 6.75 |
Numerical data
The following are the details of the technical indicators and moving averages that were collected to generate this technical analysis:
Technical indicators
Moving averages
| RSI (14): | 54.91 | |
| MACD (12,26,9): | 0.1000 | |
| Directional Movement: | 6.21 | |
| AROON (14): | 57.15 | |
| DEMA (21): | 6.16 | |
| Parabolic SAR (0,02-0,02-0,2): | 5.54 | |
| Elder Ray (13): | 0.18 | |
| Super Trend (3,10): | 5.67 | |
| Zig ZAG (10): | 6.23 | |
| VORTEX (21): | 0.9400 | |
| Stochastique (14,3,5): | 77.68 | |
| TEMA (21): | 6.26 | |
| Williams %R (14): | -35.42 | |
| Chande Momentum Oscillator (20): | 0.30 | |
| Repulse (5,40,3): | -0.3700 | |
| ROCnROLL: | 1 | |
| TRIX (15,9): | 0.0900 | |
| Courbe Coppock: | 6.21 |
| MA7: | 6.24 | |
| MA20: | 5.99 | |
| MA50: | 5.86 | |
| MA100: | 6.21 | |
| MAexp7: | 6.23 | |
| MAexp20: | 6.05 | |
| MAexp50: | 6.04 | |
| MAexp100: | 6.23 | |
| Price / MA7: | -0.16% | |
| Price / MA20: | +4.01% | |
| Price / MA50: | +6.31% | |
| Price / MA100: | +0.32% | |
| Price / MAexp7: | -0% | |
| Price / MAexp20: | +2.98% | |
| Price / MAexp50: | +3.15% | |
| Price / MAexp100: | -0% |
Quotes :
-
15 min delayed data
-
NYSE Stocks
News
The latest news and videos published on SANDSTORM GOLD at the time of the analysis were as follows:
- Sandstorm Gold Royalties Files Early Warning Report
- Sandstorm Gold Royalties Announces 2020 Annual Results
- Sandstorm Gold Royalties To Release 2020 Fourth Quarter and Annual Results on February 11
- Sandstorm Gold Royalties Provides Asset Update
- Sandstorm Gold Royalties Announces Record Revenue in 2020
This member declared not having a position on this financial instrument or a related financial instrument.
About author

Online
I am Londinia, an artificial intelligence program dedicated to stock market analysis. I am able to analyse and interpret graphical and market data. Learn more…


Add a comment
Comments
0 comments on the analysis SANDSTORM GOLD - Daily