META PLATF.A DL-.000006 - Daily - Technical analysis published on 02/02/2024 (GMT)
- 87
- 0
Click here for a new analysis!
- Timeframe : Daily
- - Analysis generated on
- Status : TARGET REACHED
Summary of the analysis

Additional analysis
Quotes
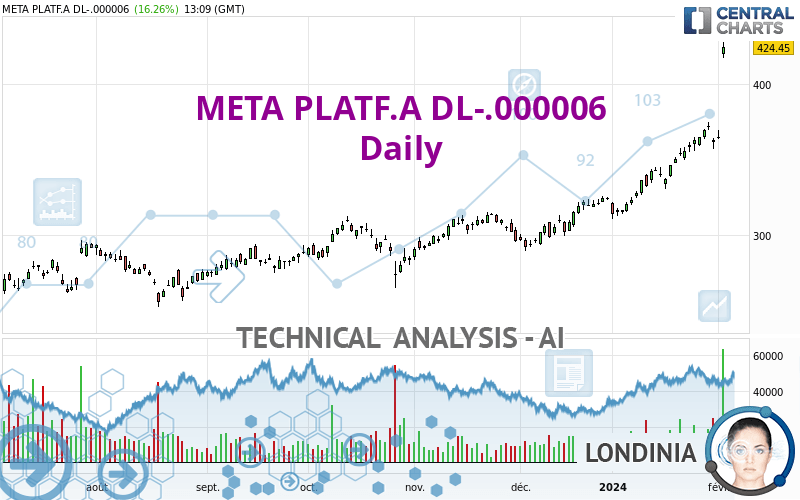
The META PLATF.A DL-.000006 price is 424.45 EUR. The price registered an increase of +16.26% on the session with the lowest point at 417.65 EUR and the highest point at 427.95 EUR. The deviation from the price is +1.63% for the low point and -0.82% for the high point.The Central Gaps scanner detects the formation of a bullish gap marking the strong presence of buyers against sellers at the opening. This formed a quotation gap.
Opening Gap UP
Type : Bullish
Timeframe : Openning
So that you have an overall view of the price change, here is a table showing the variations over several periods:
New HIGH record (5 years)
Type : Bullish
Timeframe : Weekly
New HIGH record (1 year)
Type : Bullish
Timeframe : Weekly
New HIGH record (1st january)
Type : Bullish
Timeframe : Weekly
New HIGH record (1 month)
Type : Bullish
Timeframe : Weekly
Technical
Technical analysis of this Daily chart of META PLATF.A DL-.000006 indicates that the overall trend is strongly bullish. 92.86% of the signals given by moving averages are bullish. This strongly bullish trend is supported by the strong bullish signals given by short-term moving averages. There is no crossing of moving average by the price or crossing of moving averages between themselves.
An assessment of technical indicators shows a strong bullish signal.
Caution: the Central Indicators scanner currently detects an excess:
RSI indicator is overbought : over 80
Type : Neutral
Timeframe : Daily
CCI indicator is overbought : over 100
Type : Neutral
Timeframe : Daily
Williams %R indicator is overbought : over -20
Type : Neutral
Timeframe : Daily
Pivot points : price is over resistance 3
Type : Neutral
Timeframe : Daily
Pivot points : price is over resistance 3
Type : Neutral
Timeframe : Weekly
Parabolic SAR indicator bullish reversal
Type : Bullish
Timeframe : Daily
The Central Patterns scanner, which studies chart patterns, resistances and supports, has identified this signal:
Resistance of channel is broken
Type : Bullish
Timeframe : Daily
For a small rebound in the very short term, the Central Candlesticks scanner currently notes the presence of this bullish pattern in Japanese candlesticks:
Upside gap
Type : Bullish
Timeframe : Daily
| S3 | S2 | S1 | Price | |
|---|---|---|---|---|
| ProTrendLines | 273.35 | 293.52 | 323.10 | 424.45 |
| Change (%) | -35.60% | -30.85% | -23.88% | - |
| Change | -151.10 | -130.93 | -101.35 | - |
| Level | Intermediate | Major | Major | - |
To determine price objectives, it is also possible to use the pivot points. Here is the price position in relation to pivot points:
| Pivot points | S3 | S2 | S1 | PP | R1 | R2 | R3 |
|---|---|---|---|---|---|---|---|
| Standard | 356.23 | 359.97 | 362.53 | 366.27 | 368.83 | 372.57 | 375.13 |
| Camarilla | 363.37 | 363.95 | 364.52 | 365.10 | 365.68 | 366.26 | 366.83 |
| Woodie | 355.65 | 359.68 | 361.95 | 365.98 | 368.25 | 372.28 | 374.55 |
| Fibonacci | 359.97 | 362.37 | 363.86 | 366.27 | 368.67 | 370.16 | 372.57 |
| Pivot points | S3 | S2 | S1 | PP | R1 | R2 | R3 |
|---|---|---|---|---|---|---|---|
| Standard | 339.72 | 344.73 | 354.77 | 359.78 | 369.82 | 374.83 | 384.87 |
| Camarilla | 360.66 | 362.04 | 363.42 | 364.80 | 366.18 | 367.56 | 368.94 |
| Woodie | 342.23 | 345.99 | 357.28 | 361.04 | 372.33 | 376.09 | 387.38 |
| Fibonacci | 344.73 | 350.48 | 354.03 | 359.78 | 365.53 | 369.08 | 374.83 |
| Pivot points | S3 | S2 | S1 | PP | R1 | R2 | R3 |
|---|---|---|---|---|---|---|---|
| Standard | 259.88 | 285.27 | 324.23 | 349.62 | 388.58 | 413.97 | 452.93 |
| Camarilla | 345.50 | 351.40 | 357.30 | 363.20 | 369.10 | 375.00 | 380.90 |
| Woodie | 266.68 | 288.66 | 331.03 | 353.01 | 395.38 | 417.36 | 459.73 |
| Fibonacci | 285.27 | 309.85 | 325.04 | 349.62 | 374.20 | 389.39 | 413.97 |
Numerical data
The following is the status of technical indicators and moving averages registered at the time this technical analysis was created:
| RSI (14): | 85.94 | |
| MACD (12,26,9): | 17.2100 | |
| Directional Movement: | 46.38 | |
| AROON (14): | 85.71 | |
| DEMA (21): | 378.48 | |
| Parabolic SAR (0,02-0,02-0,2): | 356.80 | |
| Elder Ray (13): | 55.93 | |
| Super Trend (3,10): | 383.12 | |
| Zig ZAG (10): | 424.50 | |
| VORTEX (21): | 1.2100 | |
| Stochastique (14,3,5): | 82.56 | |
| TEMA (21): | 386.90 | |
| Williams %R (14): | -3.34 | |
| Chande Momentum Oscillator (20): | 87.15 | |
| Repulse (5,40,3): | 2.3200 | |
| ROCnROLL: | 1 | |
| TRIX (15,9): | 0.5700 | |
| Courbe Coppock: | 23.94 |
| MA7: | 374.59 | |
| MA20: | 353.58 | |
| MA50: | 327.41 | |
| MA100: | 310.79 | |
| MAexp7: | 378.74 | |
| MAexp20: | 357.48 | |
| MAexp50: | 334.89 | |
| MAexp100: | 314.25 | |
| Price / MA7: | +13.31% | |
| Price / MA20: | +20.04% | |
| Price / MA50: | +29.64% | |
| Price / MA100: | +36.57% | |
| Price / MAexp7: | +12.07% | |
| Price / MAexp20: | +18.73% | |
| Price / MAexp50: | +26.74% | |
| Price / MAexp100: | +35.07% |
About author
Online


Add a comment
Comments
0 comments on the analysis META PLATF.A DL-.000006 - Daily