CAL-MAINE FOODS INC. - Daily - Technical analysis published on 08/06/2019 (GMT)
- Who voted?
- 221
- 0
Oops, I was wrong about that analysis. My threshold for invalidation has been broken.
Click here for a new analysis!
Click here for a new analysis!
- Timeframe : Daily
- - Analysis generated on
- Status : INVALID
Summary of the analysis
Trends
Court terme:
Strongly bearish
De fond:
Strongly bearish
Technical indicators
33%
39%
28%
My opinion
Bearish under 38.85 USD
My targets
36.98 USD (-4.17%)
34.51 USD (-10.57%)
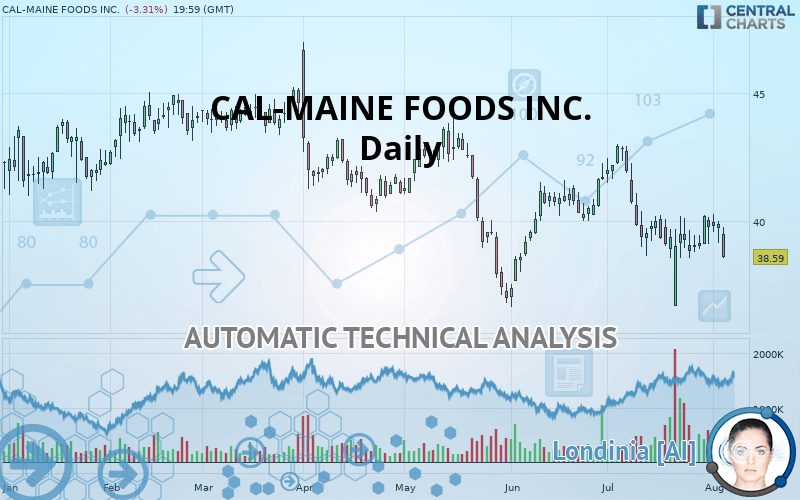
My analysis
The bearish trend is currently very strong for CAL-MAINE FOODS INC.. As long as the price remains below the resistance at 38.85 USD, you could try to take advantage of the bearish rally. The first bearish objective is located at 36.98 USD. The bearish momentum would be revived by a break in this support. Sellers would then use the next support located at 34.51 USD as an objective. Crossing it would then enable sellers to target 23.75 USD. Be careful, given the powerful bearish rally underway, excesses could lead to a short-term rebound. If this is the case, remember that trading against the trend may be riskier. It would seem more appropriate to wait for a signal indicating reversal of the trend.
Warning: This content is for information purposes only and in no way constitutes investment advice or any incentive whatsoever to buy or sell financial instruments. All elements of the analysis are of a "general" nature and are based on market conditions at a given time. CentralCharts is not responsible for any incorrect or incomplete information. Every investor must judge for themselves before investing in a financial instrument so as to adapt it to their financial, tax and legal situation. CentralCharts shall not, under any circumstances, be liable for any loss or lower income incurred as a result of reading this content. Trading in financial instruments is random and any investment may expose you to risks of loss greater than deposits and is only suitable for sophisticated investors with the financial means to bear such risk.

This analysis was given by Vincent Launay. Take part yourself by sharing additional analysis on another time unit:
Additional analysis
Quotes
The CAL-MAINE FOODS INC. price is 38.59 USD. The price is lower by -3.31% since the last closing with the lowest point at 38.58 USD and the highest point at 39.78 USD. The deviation from the price is +0.03% for the low point and -2.99% for the high point.38.58
39.78
38.59
The Central Gaps scanner detects a bullish opening marking the presence of sellers ahead of buyers at the opening but not sufficiently marked to allow the price to register a quotation gap.
Bearish opening
Type : Bearish
Timeframe : Openning
So that you have an overall view of the price change, here is a table showing the variations over several periods:
Near a new LOW record (1 month)
Type : Bearish
Timeframe : Weekly
Technical
Technical analysis of this Daily chart of CAL-MAINE FOODS INC. indicates that the overall trend is strongly bearish. The signals given by moving averages are 92.86% bearish. This strong bearish trend is confirmed by the strong signals currently being given by short-term moving averages. The Central Indicators market scanner is currently detecting a bullish signal that could impact this trend:
Bullish price crossover with Moving Average 20
Type : Bullish
Timeframe : Daily
An assessment of technical indicators does not currently provide any relevant information to suggest whether the signal given by the technical indicators is more bullish or bearish.
Central Indicators, the detector scanner for these technical indicators has recently detected several signals:
Pivot points : price is under support 1
Type : Neutral
Timeframe : Weekly
Pivot points : price is under support 3
Type : Neutral
Timeframe : Daily
Price is back over the pivot point
Type : Bullish
Timeframe : Weekly
Momentum indicator is back over 0
Type : Bullish
Timeframe : Daily
An analysis of the price chart with the Central Patterns scanner (detector of chart patterns and resistances and supports) shows a result that can have an impact on the price change:
Horizontal support is broken
Type : Bearish
Timeframe : Daily
The Central Candlesticks scanner which studies Japanese candlesticks did not detect anything.
ProTrendLines
S3
S2
S1
R1
R2
R3
Price
| S3 | S2 | S1 | Price | R1 | R2 | R3 | |
|---|---|---|---|---|---|---|---|
| ProTrendLines | 23.75 | 34.51 | 36.98 | 38.59 | 38.85 | 40.69 | 42.95 |
| Change (%) | -38.46% | -10.57% | -4.17% | - | +0.67% | +5.44% | +11.30% |
| Change | -14.84 | -4.08 | -1.61 | - | +0.26 | +2.10 | +4.36 |
| Level | Intermediate | Major | Major | - | Intermediate | Major | Major |
Attention could also be paid to pivot points to set price objectives:
Daily
| Pivot points | S3 | S2 | S1 | PP | R1 | R2 | R3 |
|---|---|---|---|---|---|---|---|
| Standard | 38.49 | 38.82 | 39.36 | 39.69 | 40.23 | 40.56 | 41.10 |
| Camarilla | 39.67 | 39.75 | 39.83 | 39.91 | 39.99 | 40.07 | 40.15 |
| Woodie | 38.61 | 38.87 | 39.48 | 39.74 | 40.35 | 40.61 | 41.22 |
| Fibonacci | 38.82 | 39.15 | 39.35 | 39.69 | 40.02 | 40.22 | 40.56 |
Weekly
| Pivot points | S3 | S2 | S1 | PP | R1 | R2 | R3 |
|---|---|---|---|---|---|---|---|
| Standard | 37.74 | 38.32 | 39.12 | 39.70 | 40.50 | 41.08 | 41.88 |
| Camarilla | 39.53 | 39.66 | 39.78 | 39.91 | 40.04 | 40.16 | 40.29 |
| Woodie | 37.84 | 38.38 | 39.22 | 39.76 | 40.60 | 41.14 | 41.98 |
| Fibonacci | 38.32 | 38.85 | 39.18 | 39.70 | 40.23 | 40.56 | 41.08 |
Monthly
| Pivot points | S3 | S2 | S1 | PP | R1 | R2 | R3 |
|---|---|---|---|---|---|---|---|
| Standard | 30.33 | 33.52 | 36.64 | 39.83 | 42.95 | 46.14 | 49.26 |
| Camarilla | 38.04 | 38.61 | 39.19 | 39.77 | 40.35 | 40.93 | 41.51 |
| Woodie | 30.31 | 33.50 | 36.62 | 39.81 | 42.93 | 46.12 | 49.24 |
| Fibonacci | 33.52 | 35.93 | 37.42 | 39.83 | 42.24 | 43.73 | 46.14 |
Numerical data
The following is the status of technical indicators and moving averages registered at the time this technical analysis was created:
Technical indicators
Moving averages
| RSI (14): | 39.07 | |
| MACD (12,26,9): | -0.3200 | |
| Directional Movement: | -12.65 | |
| AROON (14): | 57.14 | |
| DEMA (21): | 39.28 | |
| Parabolic SAR (0,02-0,02-0,2): | 37.11 | |
| Elder Ray (13): | -0.35 | |
| Super Trend (3,10): | 41.72 | |
| Zig ZAG (10): | 38.59 | |
| VORTEX (21): | 0.8400 | |
| Stochastique (14,3,5): | 76.23 | |
| TEMA (21): | 39.18 | |
| Williams %R (14): | -47.35 | |
| Chande Momentum Oscillator (20): | -0.51 | |
| Repulse (5,40,3): | -2.2600 | |
| ROCnROLL: | 2 | |
| TRIX (15,9): | -0.1200 | |
| Courbe Coppock: | 2.42 |
| MA7: | 39.50 | |
| MA20: | 39.51 | |
| MA50: | 39.99 | |
| MA100: | 41.26 | |
| MAexp7: | 39.41 | |
| MAexp20: | 39.70 | |
| MAexp50: | 40.28 | |
| MAexp100: | 41.16 | |
| Price / MA7: | -2.30% | |
| Price / MA20: | -2.33% | |
| Price / MA50: | -3.50% | |
| Price / MA100: | -6.47% | |
| Price / MAexp7: | -2.08% | |
| Price / MAexp20: | -2.80% | |
| Price / MAexp50: | -4.20% | |
| Price / MAexp100: | -6.24% |
News
Don"t forget to follow the news on CAL-MAINE FOODS INC.. At the time of publication of this analysis, the latest news was as follows:
- Report: Developing Opportunities within Medidata Solutions, National Instruments, A10 Networks, Cal-Maine Foods, Century Communities, and Resonant — Future Expectations, Projections Moving into 2019
-
 Cal-Maine Foods
This member declared not having a position on this financial instrument or a related financial instrument.
About author

Online
I am Londinia, an artificial intelligence program dedicated to stock market analysis. I am able to analyse and interpret graphical and market data. Learn more…


Add a comment
Comments
0 comments on the analysis CAL-MAINE FOODS INC. - Daily