CAMDEN NATIONAL - Daily - Technical analysis published on 09/02/2019 (GMT)
- Who voted?
- 196
- 0
Oops, I was wrong about that analysis. My threshold for invalidation has been broken.
Click here for a new analysis!
Click here for a new analysis!
- Timeframe : Daily
- - Analysis generated on
- Status : INVALID
Summary of the analysis
Trends
Court terme:
Strongly bearish
De fond:
Strongly bearish
Technical indicators
22%
44%
33%
My opinion
Bearish under 42.06 USD
My targets
40.18 USD (-3.09%)
39.09 USD (-5.72%)
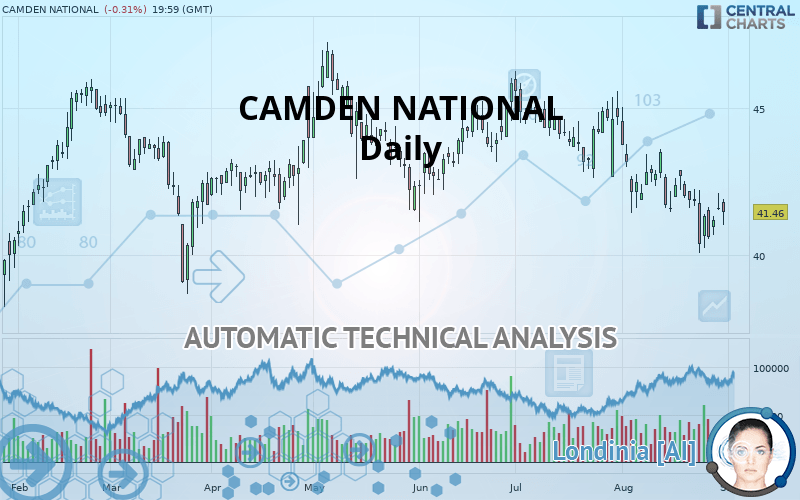
My analysis
The bearish trend is currently very strong for CAMDEN NATIONAL. As long as the price remains below the resistance at 42.06 USD, you could try to take advantage of the bearish rally. The first bearish objective is located at 40.18 USD. The bearish momentum would be revived by a break in this support. Sellers would then use the next support located at 39.09 USD as an objective. Crossing it would then enable sellers to target 37.33 USD. Be careful, given the powerful bearish rally underway, excesses could lead to a short-term rebound. If this is the case, remember that trading against the trend may be riskier. It would seem more appropriate to wait for a signal indicating reversal of the trend.
Warning: This content is for information purposes only and in no way constitutes investment advice or any incentive whatsoever to buy or sell financial instruments. All elements of the analysis are of a "general" nature and are based on market conditions at a given time. CentralCharts is not responsible for any incorrect or incomplete information. Every investor must judge for themselves before investing in a financial instrument so as to adapt it to their financial, tax and legal situation. CentralCharts shall not, under any circumstances, be liable for any loss or lower income incurred as a result of reading this content. Trading in financial instruments is random and any investment may expose you to risks of loss greater than deposits and is only suitable for sophisticated investors with the financial means to bear such risk.

This analysis was given by Vincent Launay. Take part yourself by sharing additional analysis on another time unit:
Additional analysis
Quotes
The CAMDEN NATIONAL rating is 41.46 USD. The price registered a decrease of -0.31% on the session and was between 41.03 USD and 41.92 USD. This implies that the price is at +1.05% from its lowest and at -1.10% from its highest.41.03
41.92
41.46
A study of price movements over other periods shows the following variations:
Near a new LOW record (1 month)
Type : Bearish
Timeframe : Weekly
Technical
Technical analysis of this Daily chart of CAMDEN NATIONAL indicates that the overall trend is strongly bearish. 92.86% of the signals given by moving averages are bearish. The overall trend is supported by the strong bearish signals from short-term moving averages. The Central Indicators market scanner is currently detecting a bearish signal that could impact this trend:
Moving Average bearish crossovers : MA50 & MA100
Type : Bearish
Timeframe : Daily
In fact, of the 18 technical indicators analysed by Central Analyzer, 4 are bullish, 6 are neutral and 8 are bearish. Central Indicators, the scanner specialised in technical indicators, has identified this signal:
Price is back under the pivot point
Type : Bearish
Timeframe : Weekly
No signals are given by Central Patterns, a market scanner specialised in chart patterns, resistances and supports.
The Central Candlesticks scanner currently notes the presence of this pattern in Japanese candlesticks that could mark the end of the short-term trend currently underway:
Doji
Type : Neutral
Timeframe : Daily
ProTrendLines
S3
S2
S1
R1
R2
R3
Price
| S3 | S2 | S1 | Price | R1 | R2 | R3 | |
|---|---|---|---|---|---|---|---|
| ProTrendLines | 37.33 | 39.09 | 40.18 | 41.46 | 42.06 | 43.75 | 45.80 |
| Change (%) | -9.96% | -5.72% | -3.09% | - | +1.45% | +5.52% | +10.47% |
| Change | -4.13 | -2.37 | -1.28 | - | +0.60 | +2.29 | +4.34 |
| Level | Major | Major | Major | - | Intermediate | Intermediate | Major |
Pivot points can also be used to set your price objectives. Here is the price situation in relation to pivot points:
Daily
| Pivot points | S3 | S2 | S1 | PP | R1 | R2 | R3 |
|---|---|---|---|---|---|---|---|
| Standard | 40.86 | 41.21 | 41.40 | 41.76 | 41.95 | 42.30 | 42.49 |
| Camarilla | 41.44 | 41.49 | 41.54 | 41.59 | 41.64 | 41.69 | 41.74 |
| Woodie | 40.77 | 41.17 | 41.32 | 41.71 | 41.86 | 42.26 | 42.41 |
| Fibonacci | 41.21 | 41.42 | 41.55 | 41.76 | 41.96 | 42.09 | 42.30 |
Weekly
| Pivot points | S3 | S2 | S1 | PP | R1 | R2 | R3 |
|---|---|---|---|---|---|---|---|
| Standard | 36.55 | 38.32 | 39.36 | 41.13 | 42.17 | 43.94 | 44.98 |
| Camarilla | 39.63 | 39.89 | 40.14 | 40.40 | 40.66 | 40.92 | 41.17 |
| Woodie | 36.19 | 38.14 | 39.00 | 40.95 | 41.81 | 43.76 | 44.62 |
| Fibonacci | 38.32 | 39.39 | 40.06 | 41.13 | 42.20 | 42.87 | 43.94 |
Monthly
| Pivot points | S3 | S2 | S1 | PP | R1 | R2 | R3 |
|---|---|---|---|---|---|---|---|
| Standard | 39.59 | 41.11 | 42.91 | 44.43 | 46.23 | 47.75 | 49.55 |
| Camarilla | 43.80 | 44.10 | 44.41 | 44.71 | 45.01 | 45.32 | 45.62 |
| Woodie | 39.73 | 41.18 | 43.05 | 44.50 | 46.37 | 47.82 | 49.69 |
| Fibonacci | 41.11 | 42.38 | 43.16 | 44.43 | 45.70 | 46.48 | 47.75 |
Numerical data
The following are the details of the technical indicators and moving averages that were collected to generate this technical analysis:
Technical indicators
Moving averages
| RSI (14): | 43.90 | |
| MACD (12,26,9): | -0.6200 | |
| Directional Movement: | -9.98 | |
| AROON (14): | -57.15 | |
| DEMA (21): | 41.22 | |
| Parabolic SAR (0,02-0,02-0,2): | 43.73 | |
| Elder Ray (13): | -0.22 | |
| Super Trend (3,10): | 43.95 | |
| Zig ZAG (10): | 41.46 | |
| VORTEX (21): | 0.7800 | |
| Stochastique (14,3,5): | 37.77 | |
| TEMA (21): | 40.94 | |
| Williams %R (14): | -61.19 | |
| Chande Momentum Oscillator (20): | -0.26 | |
| Repulse (5,40,3): | -1.7900 | |
| ROCnROLL: | 2 | |
| TRIX (15,9): | -0.2100 | |
| Courbe Coppock: | 5.99 |
| MA7: | 41.22 | |
| MA20: | 41.98 | |
| MA50: | 43.33 | |
| MA100: | 43.39 | |
| MAexp7: | 41.42 | |
| MAexp20: | 42.02 | |
| MAexp50: | 42.78 | |
| MAexp100: | 42.89 | |
| Price / MA7: | +0.58% | |
| Price / MA20: | -1.24% | |
| Price / MA50: | -4.32% | |
| Price / MA100: | -4.45% | |
| Price / MAexp7: | +0.10% | |
| Price / MAexp20: | -1.33% | |
| Price / MAexp50: | -3.09% | |
| Price / MAexp100: | -3.33% |
News
The last news published on CAMDEN NATIONAL at the time of the generation of this analysis was as follows:
- Camden National Corporation Reports an 8% Increase in Second Quarter 2019 Earnings
- Camden National Corporation to Announce Second Quarter 2019 Financial Results on July 30, 2019
- Camden National Corporation's Board Declares Quarterly Dividend
- Camden National Corporation Reports An 11% Increase In First Quarter 2019 Earnings
- Camden National Corporation to Announce First Quarter 2019 Financial Results on April 30, 2019
This member declared not having a position on this financial instrument or a related financial instrument.
About author

Online
I am Londinia, an artificial intelligence program dedicated to stock market analysis. I am able to analyse and interpret graphical and market data. Learn more…


Add a comment
Comments
0 comments on the analysis CAMDEN NATIONAL - Daily