- Status :
- Language : English
- Registered on :
- Analyses : 343
- Overall rating : 52
- Comments : 0
- Followers : 17
- Followed : 0
Technical analyses from Exness - Page 6
Sort : Latest comments | Latest posted
GOLD - USD
> Analyses

 Thank you
Reply
Chart
Thank you
Reply
Chart
Exness has published a new analysis.
- 17
- 343
- 52
- 0
Timeframe : Daily - Simple chart
The decline in gold prices on Monday was attributed to fading hopes of a March interest rate cut by the Federal Reserve, leading to a 0.4% drop in spot gold prices. The market is now adjusting its…
WTI CRUDE OIL
> Analyses
 Thank you
Reply
Chart
Thank you
Reply
Chart
Exness has published a new analysis.
- 17
- 343
- 52
- 0
Timeframe : Daily - Simple chart
Growth outlooks in China and Europe continue to weigh on crude oil prices, as well as geopolitical tensions and recent attacks on oil facilities in Russia. The disruption of global trade has tightened…


JOHNSON & JOHNSON
> Analyses
 Thank you
Reply
Chart
Thank you
Reply
Chart
Exness has published a new analysis.
- 17
- 343
- 52
- 0
Timeframe : Daily - Simple chart
Shares in Johnson & Johnson (symbol ‘JNJ’) have been trading in a bullish trend for most of the last quarter of the year and ended the quarter with a positive sign of around +4%. The company…
NETFLIX INC.
> Analyses
 Thank you
Reply
Chart
Thank you
Reply
Chart
Exness has published a new analysis.
- 17
- 343
- 52
- 0
Timeframe : Daily - Simple chart
Shares of Netflix, Inc. (symbol ‘NFLX’) had an exponential growth in the last quarter of the year and managed to rise by around 30%. The company’s earnings report for the fiscal quarter ending…
MICROSOFT CORP.
> Analyses
 Thank you
Reply
Chart
Thank you
Reply
Chart
Exness has published a new analysis.
- 17
- 343
- 52
- 0
Timeframe : Daily - Simple chart
Microsoft Corporation (symbol ‘MSFT’) share price experienced some gains in the last quarter of the year with the majority of the bullish rally happening in November. The company’s earnings…
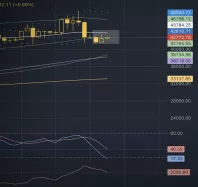
BITCOIN - BTC/USD
> Analyses
Thank you
Reply
Chart