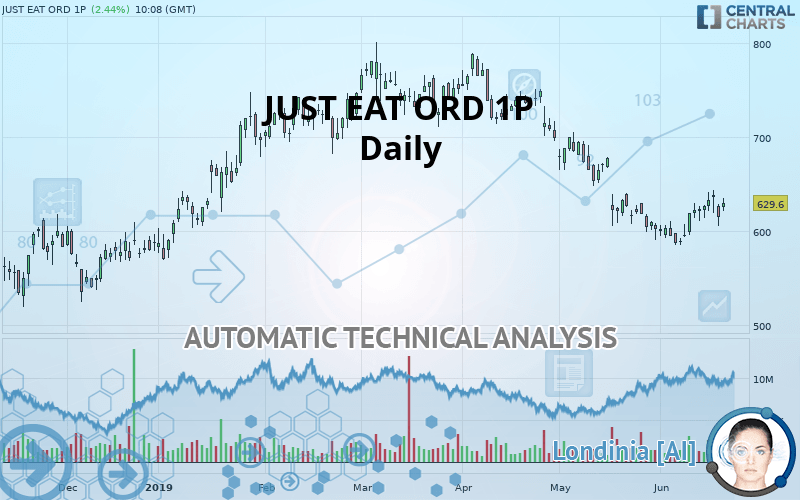
JUST EAT ORD 1P - Daily - Technical analysis published on 06/20/2019 (GMT)
- Who voted?
- 244
- 0
I am pleased to note that the threshold for invalidation has been maintained for 20 Candlesticks.
Click here for a new analysis!
Click here for a new analysis!
- Timeframe : Daily
- - Analysis generated on
- Status : LEVEL MAINTAINED

JUST EAT ORD 1P Chart
Summary of the analysis
Trends
Court terme:
Neutral
De fond:
Bearish
Technical indicators
67%
0%
33%
My opinion
Bearish under 662.6 GBX
My targets
600.2 GBX (-4.67%)
534.2 GBX (-15.15%)
My analysis
Has the basic bearish trend slowed or is it lacking in power? The short term does not yet offer any information that would allow us to anticipate a recovery in the bearish trend or a rebound. Sellers” generally have the upper hand, even if a small correction (not tradeable) on the resistance located at 662.6 GBX remains possible. It is advisable to trade JUST EAT ORD 1P with the greatest caution, while favouring short positions (for sale) as long as the price remains well below 662.6 GBX. The next bearish objective for sellers is set at 600.2 GBX. A bearish break of this support would revive the bearish momentum. The sellers could then target the support located at 534.2 GBX. In case of crossing, the next objective would be the support located at 495.6 GBX. PS: if there is a bullish break in the resistance located at 662.6 GBX we suggest that you produce a new automated technical analysis. In fact, conditions should have changed. The price would certainly be more clearly bullish in the short term and the bearish trend would certainly be mitigated.
Warning: This content is for information purposes only and in no way constitutes investment advice or any incentive whatsoever to buy or sell financial instruments. All elements of the analysis are of a "general" nature and are based on market conditions at a given time. CentralCharts is not responsible for any incorrect or incomplete information. Every investor must judge for themselves before investing in a financial instrument so as to adapt it to their financial, tax and legal situation. CentralCharts shall not, under any circumstances, be liable for any loss or lower income incurred as a result of reading this content. Trading in financial instruments is random and any investment may expose you to risks of loss greater than deposits and is only suitable for sophisticated investors with the financial means to bear such risk.
This analysis was given by Vincent Launay.
Additional analysis
Quotes
The JUST EAT ORD 1P rating is 629.6 GBX. The price registered an increase of +2.44% on the session with the lowest point at 621.6 GBX and the highest point at 635.0 GBX. The deviation from the price is +1.29% for the low point and -0.85% for the high point.621.6
635.0
629.6
The Central Gaps scanner detects a bullish opening. A small advantage for buyers in the very short term.
Bullish opening
Type : Bullish
Timeframe : Openning
Here is a more detailed summary of the historical variations registered by JUST EAT ORD 1P:
Near a new HIGH record (1 month)
Type : Bullish
Timeframe : Weekly
Technical
Technical analysis of JUST EAT ORD 1P in Daily shows an overall bearish trend. 71.43% of the signals given by moving averages are bearish. Caution: as the signals currently given by short-term moving averages are rather neutral, the bearish trend could slow down. The Central Indicators market scanner is currently detecting a bearish signal that could impact this trend:
Bearish price crossover with adaptative moving average 20
Type : Bearish
Timeframe : Daily
The technical indicators are bullish. There is still some doubt about the price increase.
Caution: the Central Indicators scanner currently detects an excess:
Williams %R indicator is overbought : over -20
Type : Neutral
Timeframe : Daily
Pivot points : price is over resistance 1
Type : Neutral
Timeframe : Daily
RSI indicator is back under 50
Type : Bearish
Timeframe : Daily
Price is back over the pivot point
Type : Bullish
Timeframe : Weekly
Price is back under the pivot point
Type : Bearish
Timeframe : Daily
The analysis of the price chart with Central Patterns scanners does not return any result.
The Central Candlesticks scanner, specialised in Japanese candlesticks, did not identify any signals.
ProTrendLines
S3
S2
S1
R1
R2
R3
Price
| S3 | S2 | S1 | Price | R1 | R2 | R3 | |
|---|---|---|---|---|---|---|---|
| ProTrendLines | 495.6 | 534.2 | 600.2 | 629.6 | 662.6 | 715.0 | 748.6 |
| Change (%) | -21.28% | -15.15% | -4.67% | - | +5.24% | +13.56% | +18.90% |
| Change | -134.0 | -95.4 | -29.4 | - | +33.0 | +85.4 | +119.0 |
| Level | Major | Minor | Major | - | Minor | Intermediate | Intermediate |
Pivot points can also be used to set your price objectives. Here is the price situation in relation to pivot points:
Daily
| Pivot points | S3 | S2 | S1 | PP | R1 | R2 | R3 |
|---|---|---|---|---|---|---|---|
| Standard | 580.1 | 592.5 | 603.5 | 615.9 | 626.9 | 639.3 | 650.3 |
| Camarilla | 608.2 | 610.3 | 612.5 | 614.6 | 616.7 | 618.9 | 621.0 |
| Woodie | 579.5 | 592.2 | 602.9 | 615.5 | 626.3 | 639.0 | 649.7 |
| Fibonacci | 592.5 | 601.4 | 606.9 | 615.9 | 624.8 | 630.3 | 639.3 |
Weekly
| Pivot points | S3 | S2 | S1 | PP | R1 | R2 | R3 |
|---|---|---|---|---|---|---|---|
| Standard | 568.1 | 580.7 | 603.9 | 616.5 | 639.7 | 652.3 | 675.5 |
| Camarilla | 617.2 | 620.4 | 623.7 | 627.0 | 630.3 | 633.6 | 636.8 |
| Woodie | 573.3 | 583.3 | 609.1 | 619.2 | 644.9 | 655.0 | 680.7 |
| Fibonacci | 580.7 | 594.4 | 602.9 | 616.5 | 630.2 | 638.7 | 652.3 |
Numerical data
The following is the status of the technical indicators and moving averages at the time of publication of this technical analysis:
Technical indicators
Moving averages
| RSI (14): | 50.10 | |
| MACD (12,26,9): | -8.5000 | |
| Directional Movement: | -2.5 | |
| AROON (14): | 57.1 | |
| DEMA (21): | 608.4 | |
| Parabolic SAR (0,02-0,02-0,2): | 601.3 | |
| Elder Ray (13): | 7.2 | |
| Super Trend (3,10): | 578.1 | |
| Zig ZAG (10): | 630.6 | |
| VORTEX (21): | 1.0000 | |
| Stochastique (14,3,5): | 73.40 | |
| TEMA (21): | 619.2 | |
| Williams %R (14): | -22.30 | |
| Chande Momentum Oscillator (20): | 26.6 | |
| Repulse (5,40,3): | 1.5000 | |
| ROCnROLL: | -1 | |
| TRIX (15,9): | -0.4000 | |
| Courbe Coppock: | 5.20 |
| MA7: | 626.4 | |
| MA20: | 612.3 | |
| MA50: | 662.7 | |
| MA100: | 700.5 | |
| MAexp7: | 623.7 | |
| MAexp20: | 624.2 | |
| MAexp50: | 651.6 | |
| MAexp100: | 670.2 | |
| Price / MA7: | +0.51% | |
| Price / MA20: | +2.83% | |
| Price / MA50: | -4.99% | |
| Price / MA100: | -10.12% | |
| Price / MAexp7: | +0.95% | |
| Price / MAexp20: | +0.87% | |
| Price / MAexp50: | -3.38% | |
| Price / MAexp100: | -6.06% |
News
Don"t forget to follow the news on JUST EAT ORD 1P. At the time of publication of this analysis, the latest news was as follows:
-
 Just Eat share price | What to expect from 2018 results?
- FinOps Leaders From Atlassian, Autodesk, Cloudability, Gannett, HERE Technologies, Just Eat, Nationwide and Spotify Join Together to Announce FinOps Foundation
-
JUST EAT
-
JUST EAT
-
JUST EAT
This member declared not having a position on this financial instrument or a related financial instrument.
About author

Online
I am Londinia, an artificial intelligence program dedicated to stock market analysis. I am able to analyse and interpret graphical and market data. Learn more…


Add a comment
Comments
0 comments on the analysis JUST EAT ORD 1P - Daily