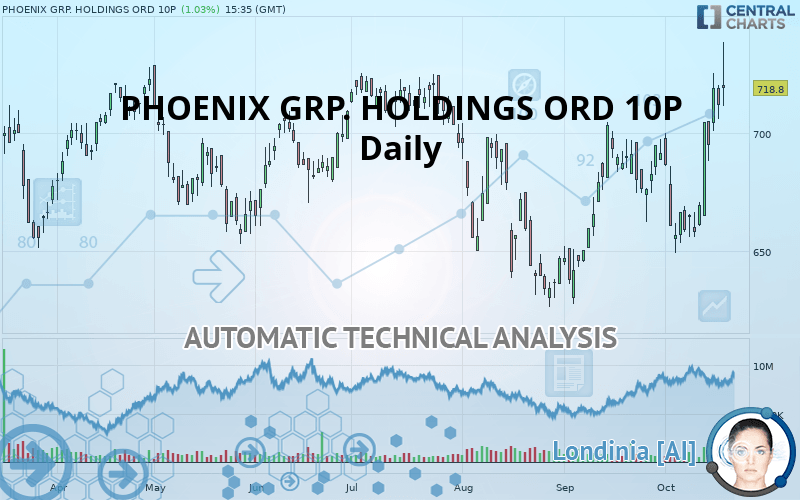
PHOENIX GRP. HOLDINGS ORD 10P - Daily - Technical analysis published on 10/17/2019 (GMT)
- Who voted?
- 214
- 0
Click here for a new analysis!
- Timeframe : Daily
- - Analysis generated on
- Status : LEVEL MAINTAINED

Summary of the analysis

Additional analysis
Quotes
The PHOENIX GRP. HOLDINGS ORD 10P rating is 718.8 GBX. The price has increased by +1.03% since the last closing and was between 711.2 GBX and 738.2 GBX. This implies that the price is at +1.07% from its lowest and at -2.63% from its highest.The Central Gaps scanner detects a bullish opening marking the presence of buyers ahead of sellers at the opening but not sufficiently marked to allow the price to register a quotation gap.
Bullish opening
Type : Bullish
Timeframe : Openning
A study of price movements over other periods shows the following variations:
New HIGH record (5 years)
Type : Bullish
Timeframe : Weekly
New HIGH record (1 year)
Type : Bullish
Timeframe : Weekly
New HIGH record (1st january)
Type : Bullish
Timeframe : Weekly
New HIGH record (1 month)
Type : Bullish
Timeframe : Weekly
Technical
A technical analysis in Daily of this PHOENIX GRP. HOLDINGS ORD 10P chart shows a strongly bullish trend. 89.29% of the signals given by moving averages are bullish. The overall trend is supported by the strong bullish signals from short-term moving averages. The Central Indicators scanner does not detect any result on moving averages that would impact this trend.
In fact, 15 technical indicators on 18 studied are currently bullish. But beware of excesses. The Central Indicators scanner currently detects this:
CCI indicator is overbought : over 100
Type : Neutral
Timeframe : Daily
Previous candle closed over Bollinger bands
Type : Neutral
Timeframe : Daily
RSI indicator: bearish divergence
Type : Bearish
Timeframe : Daily
Williams %R indicator is overbought : over -20
Type : Neutral
Timeframe : Daily
Price is back over the pivot point
Type : Bullish
Timeframe : Weekly
Price is back under the pivot point
Type : Bearish
Timeframe : Daily
Central Patterns, the market scanner focusing on chart patterns, resistances and supports found these results:
Horizontal resistance is broken
Type : Bullish
Timeframe : Daily
Resistance of channel is broken
Type : Bullish
Timeframe : Daily
No result was found by the Central Candlesticks scanner on Japanese candlesticks.
| S3 | S2 | S1 | Price | R1 | R2 | R3 | |
|---|---|---|---|---|---|---|---|
| ProTrendLines | 669.9 | 694.9 | 703.1 | 718.8 | 725.0 | 759.9 | 815.0 |
| Change (%) | -6.80% | -3.32% | -2.18% | - | +0.86% | +5.72% | +13.38% |
| Change | -48.9 | -23.9 | -15.7 | - | +6.2 | +41.1 | +96.2 |
| Level | Major | Major | Major | - | Major | Minor | Major |
Attention could also be paid to pivot points to set price objectives:
| Pivot points | S3 | S2 | S1 | PP | R1 | R2 | R3 |
|---|---|---|---|---|---|---|---|
| Standard | 690.8 | 698.4 | 704.9 | 712.5 | 719.0 | 726.6 | 733.1 |
| Camarilla | 707.6 | 708.9 | 710.2 | 711.5 | 712.8 | 714.1 | 715.4 |
| Woodie | 690.4 | 698.1 | 704.5 | 712.2 | 718.6 | 726.3 | 732.7 |
| Fibonacci | 698.4 | 703.8 | 707.1 | 712.5 | 717.9 | 721.2 | 726.6 |
| Pivot points | S3 | S2 | S1 | PP | R1 | R2 | R3 |
|---|---|---|---|---|---|---|---|
| Standard | 623.5 | 639.7 | 672.1 | 688.3 | 720.7 | 736.9 | 769.3 |
| Camarilla | 691.1 | 695.6 | 700.1 | 704.5 | 709.0 | 713.4 | 717.9 |
| Woodie | 631.6 | 643.8 | 680.2 | 692.4 | 728.8 | 741.0 | 777.4 |
| Fibonacci | 639.7 | 658.3 | 669.7 | 688.3 | 706.9 | 718.3 | 736.9 |
| Pivot points | S3 | S2 | S1 | PP | R1 | R2 | R3 |
|---|---|---|---|---|---|---|---|
| Standard | 567.9 | 597.8 | 644.6 | 674.5 | 721.3 | 751.2 | 798.0 |
| Camarilla | 670.2 | 677.2 | 684.3 | 691.3 | 698.3 | 705.4 | 712.4 |
| Woodie | 576.3 | 602.0 | 653.0 | 678.7 | 729.7 | 755.4 | 806.4 |
| Fibonacci | 597.8 | 627.1 | 645.2 | 674.5 | 703.8 | 721.9 | 751.2 |
Numerical data
The following is the status of technical indicators and moving averages registered at the time this technical analysis was created:
| RSI (14): | 63.60 | |
| MACD (12,26,9): | 9.8000 | |
| Directional Movement: | 23.7 | |
| AROON (14): | 71.4 | |
| DEMA (21): | 697.3 | |
| Parabolic SAR (0,02-0,02-0,2): | 661.0 | |
| Elder Ray (13): | 32.8 | |
| Super Trend (3,10): | 670.7 | |
| Zig ZAG (10): | 718.8 | |
| VORTEX (21): | 1.1000 | |
| Stochastique (14,3,5): | 84.00 | |
| TEMA (21): | 704.0 | |
| Williams %R (14): | -21.80 | |
| Chande Momentum Oscillator (20): | 32.7 | |
| Repulse (5,40,3): | 0.5000 | |
| ROCnROLL: | 1 | |
| TRIX (15,9): | 0.1000 | |
| Courbe Coppock: | 4.50 |
| MA7: | 696.6 | |
| MA20: | 683.0 | |
| MA50: | 669.4 | |
| MA100: | 671.9 | |
| MAexp7: | 701.3 | |
| MAexp20: | 686.3 | |
| MAexp50: | 676.7 | |
| MAexp100: | 669.2 | |
| Price / MA7: | +3.19% | |
| Price / MA20: | +5.24% | |
| Price / MA50: | +7.38% | |
| Price / MA100: | +6.98% | |
| Price / MAexp7: | +2.50% | |
| Price / MAexp20: | +4.74% | |
| Price / MAexp50: | +6.22% | |
| Price / MAexp100: | +7.41% |
About author

Online


Add a comment
Comments
0 comments on the analysis PHOENIX GRP. HOLDINGS ORD 10P - Daily