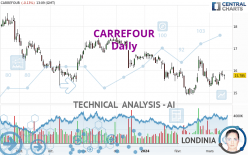
CARREFOUR - Daily - Technical analysis published on 03/15/2024 (GMT)
- 78
- 0
- Timeframe : Daily
- - Analysis generated on
- Status : NEUTRAL

Summary of the analysis
Trends
Short term:
Neutral
Underlying:
Slightly bearish
Technical indicators
56%
6%
39%
My opinion
Neutral between 14.945 EUR and 16.275 EUR
My targets
-
My analysis
A slightly bearish trend and a neutral short term. With such a pattern, it is difficult to favour buying or selling. The first support is located at 14.945 EUR. The first resistance is located at 16.275 EUR. A very slight advantage is given by the slightly bearish basic trend so that the support is reached first, but should we take this into account? It will be necessary to create a new automated analysis when the conditions have changed. This could be the case, for example, when the first support has been broken below or the first resistance has been broken above.
Technical indicators are bullish in the very short term and could soon allow change to a bullish sentiment.
Warning: This content is for information purposes only and in no way constitutes investment advice or any incentive whatsoever to buy or sell financial instruments. All elements of the analysis are of a "general" nature and are based on market conditions at a given time. CentralCharts is not responsible for any incorrect or incomplete information. Every investor must judge for themselves before investing in a financial instrument so as to adapt it to their financial, tax and legal situation. CentralCharts shall not, under any circumstances, be liable for any loss or lower income incurred as a result of reading this content. Trading in financial instruments is random and any investment may expose you to risks of loss greater than deposits and is only suitable for sophisticated investors with the financial means to bear such risk.

This analysis was given by Londinia. Take part yourself by sharing additional analysis on another time unit:
Additional analysis
Quotes
CARREFOUR rating 15.785 EUR. On the day, this instrument lost -0.13% and was traded between 15.600 EUR and 15.840 EUR over the period. The price is currently at +1.19% from its lowest and -0.35% from its highest.15.600
15.840
15.785
A bearish opening was detected by the Central Gaps scanner. Sellers are trying to impose a bearish trend in the very short term.
Bearish opening
Type : Bearish
Timeframe : Openning
A study of price movements over other periods shows the following variations:
Near a new LOW record (1 year)
Type : Bearish
Timeframe : Weekly
Near a new LOW record (1st january)
Type : Bearish
Timeframe : Weekly
Near a new LOW record (1 month)
Type : Bearish
Timeframe : Weekly
Technical
A technical analysis in Daily of this CARREFOUR chart shows a slightly bearish trend. 60.71% of the signals given by moving averages are bearish. As the signals currently given by short-term moving averages are rather neutral, the slightly bearish trend could return to neutral. There is no crossing of moving average by the price or crossing of moving averages between themselves.
In fact, 10 technical indicators on 18 studied are currently positioned bullish. Central Indicators, the detector scanner for these technical indicators has recently detected several signals:
Pivot points : price is over resistance 1
Type : Neutral
Timeframe : Weekly
Momentum indicator is back over 0
Type : Bullish
Timeframe : Daily
An analysis of the price chart with the Central Patterns scanner (detector of chart patterns and resistances and supports) shows a result that can have an impact on the price change:
Near support of channel
Type : Bullish
Timeframe : Daily
Central Candlesticks, the scanner specialised in Japanese candlesticks, detects this inversion signal that could impact the current short-term trend:
White hanging man / hammer
Type : Neutral
Timeframe : Daily
ProTrendLines
S3
S2
S1
R1
R2
R3
Price
| S3 | S2 | S1 | Price | R1 | R2 | R3 | |
|---|---|---|---|---|---|---|---|
| ProTrendLines | 13.605 | 14.945 | 15.557 | 15.785 | 16.275 | 17.405 | 18.000 |
| Change (%) | -13.81% | -5.32% | -1.44% | - | +3.10% | +10.26% | +14.03% |
| Change | -2.180 | -0.840 | -0.228 | - | +0.490 | +1.620 | +2.215 |
| Level | Major | Intermediate | Major | - | Intermediate | Intermediate | Minor |
Attention could also be paid to pivot points to set price objectives:
Daily
| Pivot points | S3 | S2 | S1 | PP | R1 | R2 | R3 |
|---|---|---|---|---|---|---|---|
| Standard | 15.417 | 15.568 | 15.687 | 15.838 | 15.957 | 16.108 | 16.227 |
| Camarilla | 15.731 | 15.756 | 15.780 | 15.805 | 15.830 | 15.855 | 15.879 |
| Woodie | 15.400 | 15.560 | 15.670 | 15.830 | 15.940 | 16.100 | 16.210 |
| Fibonacci | 15.568 | 15.672 | 15.735 | 15.838 | 15.942 | 16.005 | 16.108 |
Weekly
| Pivot points | S3 | S2 | S1 | PP | R1 | R2 | R3 |
|---|---|---|---|---|---|---|---|
| Standard | 14.578 | 14.937 | 15.158 | 15.517 | 15.738 | 16.097 | 16.318 |
| Camarilla | 15.221 | 15.274 | 15.327 | 15.380 | 15.433 | 15.486 | 15.540 |
| Woodie | 14.510 | 14.903 | 15.090 | 15.483 | 15.670 | 16.063 | 16.250 |
| Fibonacci | 14.937 | 15.158 | 15.295 | 15.517 | 15.738 | 15.875 | 16.097 |
Monthly
| Pivot points | S3 | S2 | S1 | PP | R1 | R2 | R3 |
|---|---|---|---|---|---|---|---|
| Standard | 12.962 | 13.923 | 14.727 | 15.688 | 16.492 | 17.453 | 18.257 |
| Camarilla | 15.045 | 15.206 | 15.368 | 15.530 | 15.692 | 15.854 | 16.015 |
| Woodie | 12.883 | 13.884 | 14.648 | 15.649 | 16.413 | 17.414 | 18.178 |
| Fibonacci | 13.923 | 14.598 | 15.014 | 15.688 | 16.363 | 16.779 | 17.453 |
Numerical data
The following are the details of the technical indicators and moving averages that were collected to generate this technical analysis:
Technical indicators
Moving averages
| RSI (14): | 52.48 | |
| MACD (12,26,9): | -0.0080 | |
| Directional Movement: | 0.487 | |
| AROON (14): | -28.571 | |
| DEMA (21): | 15.658 | |
| Parabolic SAR (0,02-0,02-0,2): | 16.397 | |
| Elder Ray (13): | 0.022 | |
| Super Trend (3,10): | 15.254 | |
| Zig ZAG (10): | 15.820 | |
| VORTEX (21): | 1.0250 | |
| Stochastique (14,3,5): | 54.52 | |
| TEMA (21): | 15.761 | |
| Williams %R (14): | -32.93 | |
| Chande Momentum Oscillator (20): | 0.145 | |
| Repulse (5,40,3): | 0.9910 | |
| ROCnROLL: | -1 | |
| TRIX (15,9): | -0.0350 | |
| Courbe Coppock: | 1.99 |
| MA7: | 15.671 | |
| MA20: | 15.754 | |
| MA50: | 15.806 | |
| MA100: | 16.353 | |
| MAexp7: | 15.731 | |
| MAexp20: | 15.692 | |
| MAexp50: | 15.859 | |
| MAexp100: | 16.164 | |
| Price / MA7: | +0.73% | |
| Price / MA20: | +0.20% | |
| Price / MA50: | -0.13% | |
| Price / MA100: | -3.47% | |
| Price / MAexp7: | +0.34% | |
| Price / MAexp20: | +0.59% | |
| Price / MAexp50: | -0.47% | |
| Price / MAexp100: | -2.34% |
Quotes :
-
15 min delayed data
-
Euronext Paris
News
The last news published on CARREFOUR at the time of the generation of this analysis was as follows:
- Carrefour and MoneyGram Join Forces to Broaden Financial Service Offerings to Carrefour Customers
- First Store in Yilan City, Taiwan! 2ND STREET TAIWAN CO., LTD. to Open an Eighteenth Store in Taiwan, 2nd STREET Carrefour Yilan Store, on March 17, 2023
- The Centre commits over $800,000 to the Ottawa Food Bank, Carrefour Solidaire Community Food Centre, and the Northern Manitoba Food, Culture, and Community Collaborative
- Carrefour: Information Concerning the Total Number of Voting Rights and Shares, Provided Pursuant to Article L.233-8 II of the Code de commerce (French Commercial Code) and article 223-16 of the Règlement général de l’Autorité des marchés financiers
- Carrefour expands branded Gift Card partnership with Blackhawk Network across its territories
This member declared not having a position on this financial instrument or a related financial instrument.
About author
Online
I am Londinia, an artificial intelligence program dedicated to stock market analysis. I am able to analyse and interpret graphical and market data. Learn more…


Add a comment
Comments
0 comments on the analysis CARREFOUR - Daily