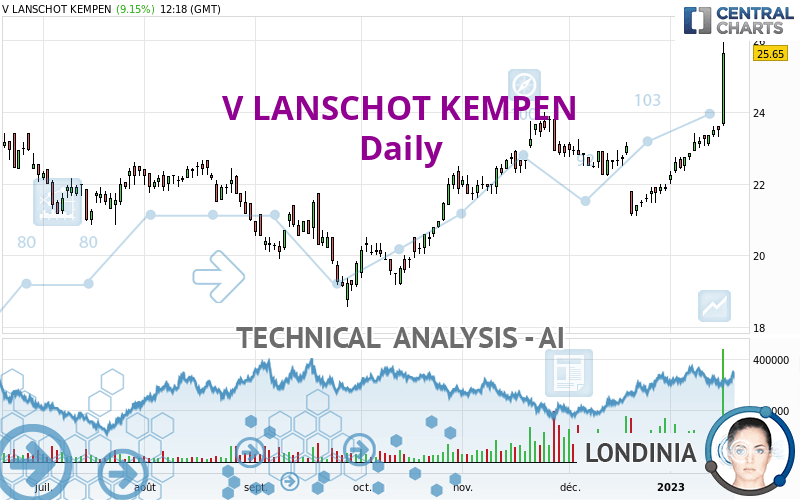
V LANSCHOT KEMPEN - Daily - Technical analysis published on 01/17/2023 (GMT)
- 128
- 0
Click here for a new analysis!
- Timeframe : Daily
- - Analysis generated on
- Status : LEVEL MAINTAINED
Summary of the analysis

Additional analysis
Quotes
The V LANSCHOT KEMPEN rating is 25.65 EUR. The price has increased by +9.15% since the last closing and was between 23.60 EUR and 25.95 EUR. This implies that the price is at +8.69% from its lowest and at -1.16% from its highest.The Central Gaps scanner detects the formation of a bullish gap marking the strong presence of buyers against sellers at the opening. This formed a quotation gap.
Opening Gap UP
Type : Bullish
Timeframe : Openning
A study of price movements over other periods shows the following variations:
New HIGH record (5 years)
Type : Bullish
Timeframe : Weekly
New HIGH record (1 year)
Type : Bullish
Timeframe : Weekly
New HIGH record (1st january)
Type : Bullish
Timeframe : Weekly
New HIGH record (1 month)
Type : Bullish
Timeframe : Weekly
The Central Volumes scanner notes the presence of abnormal volumes:
Abnormal volumes
Timeframe : 5 days
Abnormal volumes
Timeframe : 20 days
Abnormal volumes
Timeframe : 50 days
Technical
Technical analysis of V LANSCHOT KEMPEN in Daily shows a strongly overall bullish trend. 92.86% of the signals given by moving averages are bullish. The overall trend is supported by the strong bullish signals from short-term moving averages. The Central Indicators market scanner currently does not detect any result that concerns moving averages.
The probability of a further increase is high given the direction of the technical indicators.
Caution: the Central Indicators scanner currently detects an excess:
RSI indicator is overbought : over 80
Type : Neutral
Timeframe : Daily
CCI indicator is overbought : over 100
Type : Neutral
Timeframe : Daily
Williams %R indicator is overbought : over -20
Type : Neutral
Timeframe : Daily
Pivot points : price is over resistance 3
Type : Neutral
Timeframe : Daily
Pivot points : price is over resistance 3
Type : Neutral
Timeframe : Weekly
Central Patterns, the market scanner focusing on chart patterns, resistances and supports found these results:
Near horizontal resistance
Type : Bearish
Timeframe : Daily
Resistance of channel is broken
Type : Bullish
Timeframe : Daily
The presence of a bullish Japanese candlestick pattern detected by Central Candlesticks that could cause a very short term rebound was also detected:
Long white line
Type : Bullish
Timeframe : Daily
| S3 | S2 | S1 | Price | R1 | R2 | |
|---|---|---|---|---|---|---|
| ProTrendLines | 20.80 | 22.28 | 23.28 | 25.65 | 31.84 | 36.99 |
| Change (%) | -18.91% | -13.14% | -9.24% | - | +24.13% | +44.21% |
| Change | -4.85 | -3.37 | -2.37 | - | +6.19 | +11.34 |
| Level | Intermediate | Major | Major | - | Minor | Intermediate |
Pivot points can also be used to set your price objectives. Here is the price situation in relation to pivot points:
| Pivot points | S3 | S2 | S1 | PP | R1 | R2 | R3 |
|---|---|---|---|---|---|---|---|
| Standard | 23.03 | 23.17 | 23.33 | 23.47 | 23.63 | 23.77 | 23.93 |
| Camarilla | 23.42 | 23.45 | 23.47 | 23.50 | 23.53 | 23.56 | 23.58 |
| Woodie | 23.05 | 23.18 | 23.35 | 23.48 | 23.65 | 23.78 | 23.95 |
| Fibonacci | 23.17 | 23.28 | 23.35 | 23.47 | 23.58 | 23.65 | 23.77 |
| Pivot points | S3 | S2 | S1 | PP | R1 | R2 | R3 |
|---|---|---|---|---|---|---|---|
| Standard | 22.37 | 22.63 | 23.07 | 23.33 | 23.77 | 24.03 | 24.47 |
| Camarilla | 23.31 | 23.37 | 23.44 | 23.50 | 23.56 | 23.63 | 23.69 |
| Woodie | 22.45 | 22.68 | 23.15 | 23.38 | 23.85 | 24.08 | 24.55 |
| Fibonacci | 22.63 | 22.90 | 23.07 | 23.33 | 23.60 | 23.77 | 24.03 |
| Pivot points | S3 | S2 | S1 | PP | R1 | R2 | R3 |
|---|---|---|---|---|---|---|---|
| Standard | 19.87 | 20.31 | 21.11 | 21.55 | 22.35 | 22.79 | 23.59 |
| Camarilla | 21.56 | 21.67 | 21.79 | 21.90 | 22.01 | 22.13 | 22.24 |
| Woodie | 20.04 | 20.40 | 21.28 | 21.64 | 22.52 | 22.88 | 23.76 |
| Fibonacci | 20.31 | 20.79 | 21.08 | 21.55 | 22.03 | 22.32 | 22.79 |
Numerical data
The following is the status of technical indicators and moving averages registered at the time this technical analysis was created:
| RSI (14): | 88.70 | |
| MACD (12,26,9): | 0.7400 | |
| Directional Movement: | 51.24 | |
| AROON (14): | 100.00 | |
| DEMA (21): | 23.73 | |
| Parabolic SAR (0,02-0,02-0,2): | 23.09 | |
| Elder Ray (13): | 1.52 | |
| Super Trend (3,10): | 23.10 | |
| Zig ZAG (10): | 25.55 | |
| VORTEX (21): | 1.2200 | |
| Stochastique (14,3,5): | 93.76 | |
| TEMA (21): | 24.12 | |
| Williams %R (14): | -9.41 | |
| Chande Momentum Oscillator (20): | 3.70 | |
| Repulse (5,40,3): | 10.4200 | |
| ROCnROLL: | 1 | |
| TRIX (15,9): | 0.3400 | |
| Courbe Coppock: | 18.73 |
| MA7: | 23.65 | |
| MA20: | 22.57 | |
| MA50: | 21.80 | |
| MA100: | 20.51 | |
| MAexp7: | 23.81 | |
| MAexp20: | 22.85 | |
| MAexp50: | 21.89 | |
| MAexp100: | 21.21 | |
| Price / MA7: | +8.46% | |
| Price / MA20: | +13.65% | |
| Price / MA50: | +17.66% | |
| Price / MA100: | +25.06% | |
| Price / MAexp7: | +7.73% | |
| Price / MAexp20: | +12.25% | |
| Price / MAexp50: | +17.18% | |
| Price / MAexp100: | +20.93% |
News
Don't forget to follow the news on V LANSCHOT KEMPEN. At the time of publication of this analysis, the latest news was as follows:
- Van Lanschot Kempen and Mercier Vanderlinden to take next step in collaboration by accelerating acquisition of remaining stake
- Van Lanschot Kempen to return capital of €1.50 per share on 22 December 2022
- Van Lanschot Kempen: third-quarter trading update
- Van Lanschot Kempen’s shareholders agree to proposed return of capital
- Van Lanschot Kempen: net profit €48.2 million and €4.9 billion in net AuM inflows in H1 2022
About author
Online


Add a comment
Comments
0 comments on the analysis V LANSCHOT KEMPEN - Daily