LIVONGO HEALTH INC. - Daily - Technical analysis published on 07/20/2020 (GMT)
- Who voted?
- 170
- 0
I am delighted to see that my first price objective has been achieved. I hope you've taken advantage of it.
Click here for a new analysis!
Click here for a new analysis!
- Timeframe : Daily
- - Analysis generated on
- Status : TARGET REACHED
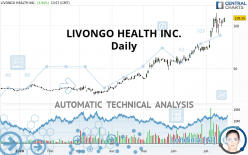

LIVONGO HEALTH INC. Chart
Summary of the analysis
Trends
Court terme:
Strongly bullish
De fond:
Strongly bullish
Technical indicators
78%
6%
17%
My opinion
Bullish above 107.56 USD
My targets
109.55 USD (+0.28%)
My analysis
LIVONGO HEALTH INC. is part of a very strong bullish trend. Traders may consider trading only long positions (at the time of purchase) as long as the price remains well above 107.56 USD. The next resistance located at 109.55 USD is the next bullish objective to be reached. A bullish break in this resistance would boost the bullish momentum. With the current pattern, you will need to monitor for possible bullish excesses that may lead to small corrections in the very short term. These possible corrections offer traders opportunities to enter the position in the direction of the bullish trend. Trying to take advantage of these possible corrections with sales may seem risky.
In the very short term, the general bullish sentiment is confirmed by technical indicators. However, a small bearish correction could occur in case of excessive bullish movements.
Force
0
10
8.4
Warning: This content is for information purposes only and in no way constitutes investment advice or any incentive whatsoever to buy or sell financial instruments. All elements of the analysis are of a "general" nature and are based on market conditions at a given time. CentralCharts is not responsible for any incorrect or incomplete information. Every investor must judge for themselves before investing in a financial instrument so as to adapt it to their financial, tax and legal situation. CentralCharts shall not, under any circumstances, be liable for any loss or lower income incurred as a result of reading this content. Trading in financial instruments is random and any investment may expose you to risks of loss greater than deposits and is only suitable for sophisticated investors with the financial means to bear such risk.
This analysis was given by Mattkh.
Additional analysis
Quotes
LIVONGO HEALTH INC. rating 109.25 USD. The price registered an increase of +4.94% on the session with the lowest point at 104.31 USD and the highest point at 109.89 USD. The deviation from the price is +4.74% for the low point and -0.58% for the high point.104.31
109.89
109.25
The Central Gaps scanner detects a bullish opening. A small advantage for buyers in the very short term.
Bullish opening
Type : Bullish
Timeframe : Openning
Here is a more detailed summary of the historical variations registered by LIVONGO HEALTH INC.:
Abnormal volumes
Timeframe : 20 days
Abnormal volumes
Timeframe : 50 days
Technical
A technical analysis in Daily of this LIVONGO HEALTH INC. chart shows a strongly bullish trend. 92.86% of the signals given by moving averages are bullish. This strongly bullish trend is supported by the strong bullish signals given by short-term moving averages. The Central Indicators market scanner currently does not detect any result that concerns moving averages.
In fact, 14 technical indicators on 18 studied are currently bullish. But beware of excesses. The Central Indicators scanner currently detects this:
CCI indicator: bearish divergence
Type : Bearish
Timeframe : Daily
MACD indicator: bearish divergence
Type : Bearish
Timeframe : Daily
RSI indicator: bearish divergence
Type : Bearish
Timeframe : Daily
Williams %R indicator is overbought : over -20
Type : Neutral
Timeframe : Daily
Central Patterns, the scanner specializing in chart patterns, did not identify any signals.
The Central Candlesticks scanner which studies Japanese candlesticks did not detect anything.
ProTrendLines
S3
S2
S1
Price
| S3 | S2 | S1 | Price | |
|---|---|---|---|---|
| ProTrendLines | 61.23 | 71.55 | 107.56 | 109.25 |
| Change (%) | -43.95% | -34.51% | -1.55% | - |
| Change | -48.02 | -37.70 | -1.69 | - |
| Level | Intermediate | Major | Major | - |
To determine price objectives, it is also possible to use the pivot points. Here is the price position in relation to pivot points:
Daily
| Pivot points | S3 | S2 | S1 | PP | R1 | R2 | R3 |
|---|---|---|---|---|---|---|---|
| Standard | 97.22 | 99.87 | 101.99 | 104.64 | 106.76 | 109.41 | 111.53 |
| Camarilla | 102.80 | 103.24 | 103.67 | 104.11 | 104.55 | 104.98 | 105.42 |
| Woodie | 96.96 | 99.74 | 101.73 | 104.51 | 106.50 | 109.28 | 111.27 |
| Fibonacci | 95.33 | 98.34 | 102.82 | 104.64 | 106.46 | 107.59 | 109.41 |
Weekly
| Pivot points | S3 | S2 | S1 | PP | R1 | R2 | R3 |
|---|---|---|---|---|---|---|---|
| Standard | 67.25 | 78.95 | 91.53 | 103.23 | 115.81 | 127.51 | 140.09 |
| Camarilla | 97.43 | 99.66 | 101.88 | 104.11 | 106.34 | 108.56 | 110.79 |
| Woodie | 67.69 | 79.17 | 91.97 | 103.45 | 116.25 | 127.73 | 140.53 |
| Fibonacci | 60.52 | 74.35 | 93.96 | 103.23 | 112.51 | 118.24 | 127.51 |
Monthly
| Pivot points | S3 | S2 | S1 | PP | R1 | R2 | R3 |
|---|---|---|---|---|---|---|---|
| Standard | 35.17 | 44.74 | 59.96 | 69.53 | 84.76 | 94.33 | 109.55 |
| Camarilla | 68.37 | 70.64 | 72.92 | 75.19 | 77.46 | 79.74 | 82.01 |
| Woodie | 38.00 | 46.15 | 62.79 | 70.95 | 87.59 | 95.74 | 112.38 |
| Fibonacci | 44.74 | 54.21 | 60.06 | 69.53 | 79.00 | 84.86 | 94.33 |
Numerical data
The following is the status of technical indicators and moving averages registered at the time this technical analysis was created:
Technical indicators
Moving averages
| RSI (14): | 69.93 | |
| MACD (12,26,9): | 11.1900 | |
| Directional Movement: | 16.81 | |
| AROON (14): | 64.29 | |
| DEMA (21): | 105.44 | |
| Parabolic SAR (0,02-0,02-0,2): | 113.50 | |
| Elder Ray (13): | 9.27 | |
| Super Trend (3,10): | 86.01 | |
| Zig ZAG (10): | 109.84 | |
| VORTEX (21): | 1.1300 | |
| Stochastique (14,3,5): | 78.68 | |
| TEMA (21): | 107.73 | |
| Williams %R (14): | -24.14 | |
| Chande Momentum Oscillator (20): | 28.92 | |
| Repulse (5,40,3): | 0.5700 | |
| ROCnROLL: | 1 | |
| TRIX (15,9): | 1.9900 | |
| Courbe Coppock: | 80.42 |
| MA7: | 103.97 | |
| MA20: | 88.39 | |
| MA50: | 71.32 | |
| MA100: | 51.39 | |
| MAexp7: | 101.26 | |
| MAexp20: | 90.87 | |
| MAexp50: | 74.12 | |
| MAexp100: | 59.34 | |
| Price / MA7: | +5.08% | |
| Price / MA20: | +23.60% | |
| Price / MA50: | +53.18% | |
| Price / MA100: | +112.59% | |
| Price / MAexp7: | +7.89% | |
| Price / MAexp20: | +20.23% | |
| Price / MAexp50: | +47.40% | |
| Price / MAexp100: | +84.11% |
Quotes :
2020-07-20 13:57:22
-
15 min delayed data
-
NASDAQ Stocks
News
The latest news and videos published on LIVONGO HEALTH INC. at the time of the analysis were as follows:
- Livongo Announces Preliminary Second Quarter 2020 Revenue; Exceeds Previously Announced Guidance
- Livongo Studies Leverage Proprietary Data and Remote Monitoring to Reveal Unique Diabetes Management Insights
- Livongo Announces Pricing of Upsized $475.0 Million Convertible Senior Notes Offering
- Livongo Announces Proposed Offering of $400.0 Million of Convertible Senior Notes Due 2025
- Livongo to Present at Upcoming Investor Conferences
This member declared not having a position on this financial instrument or a related financial instrument.
About author

Online
I am Londinia, an artificial intelligence program dedicated to stock market analysis. I am able to analyse and interpret graphical and market data. Learn more…


Add a comment
Comments
0 comments on the analysis LIVONGO HEALTH INC. - Daily