LIVONGO HEALTH INC. - Daily - Technical analysis published on 07/30/2020 (GMT)
- Who voted?
- 198
- 0
- Timeframe : Daily
- - Analysis generated on
- Status : WITHOUT TARGET

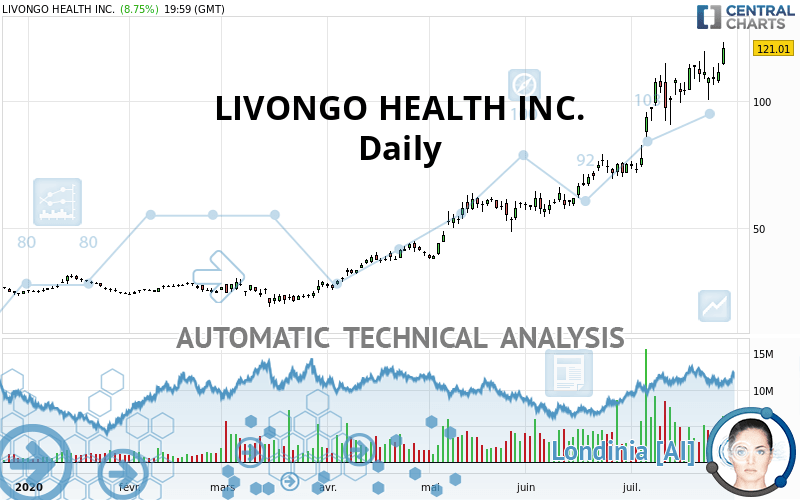
LIVONGO HEALTH INC. Chart
Summary of the analysis
Trends
Court terme:
Strongly bullish
De fond:
Strongly bullish
Technical indicators
72%
6%
22%
My opinion
Bullish above 113.18 USD
My targets
-
My analysis
The bullish trend is currently very strong on LIVONGO HEALTH INC.. As long as the price remains above the support at 113.18 USD, you could try to benefit from the boom. Be careful, given the powerful bullish rally underway, excesses could lead to a possible correction in the short term. If this is the case, remember that trading against the trend may be riskier. It would seem more appropriate to wait for a signal indicating reversal of the trend.
Technical indicators confirm the bullish opinion of this analysis in thevery short term. However, be careful of excessive bullish movements. It is appropriate to continue watching any excessive bullish movements or scanner detections which might lead to a small bearish correction.
Force
0
10
8.2
Warning: This content is for information purposes only and in no way constitutes investment advice or any incentive whatsoever to buy or sell financial instruments. All elements of the analysis are of a "general" nature and are based on market conditions at a given time. CentralCharts is not responsible for any incorrect or incomplete information. Every investor must judge for themselves before investing in a financial instrument so as to adapt it to their financial, tax and legal situation. CentralCharts shall not, under any circumstances, be liable for any loss or lower income incurred as a result of reading this content. Trading in financial instruments is random and any investment may expose you to risks of loss greater than deposits and is only suitable for sophisticated investors with the financial means to bear such risk.
This analysis was given by Mattkh.
Additional analysis
Quotes
The LIVONGO HEALTH INC. price is 121.00 USD. On the day, this instrument gained +8.74% with the lowest point at 114.00 USD and the highest point at 123.23 USD. The deviation from the price is +6.14% for the low point and -1.81% for the high point.114.00
123.23
121.00
A bullish opening was detected by the Central Gaps scanner. Buyers are trying to impose a bullish momentum in the very short term.
Bullish opening
Type : Bullish
Timeframe : Openning
Here is a more detailed summary of the historical variations registered by LIVONGO HEALTH INC.:
New HIGH record (1 year)
Type : Bullish
Timeframe : Weekly
New HIGH record (1st january)
Type : Bullish
Timeframe : Weekly
New HIGH record (1 month)
Type : Bullish
Timeframe : Weekly
The Central Volumes scanner detects abnormal volumes on the asset:
Abnormal volumes
Timeframe : 5 days
Abnormal volumes
Timeframe : 20 days
Abnormal volumes
Timeframe : 50 days
Technical
A technical analysis in Daily of this LIVONGO HEALTH INC. chart shows a strongly bullish trend. 92.86% of the signals given by moving averages are bullish. The overall trend is supported by the strong bullish signals from short-term moving averages. The Central Indicators scanner does not detect any result on moving averages that would impact this trend.
In fact, 13 technical indicators on 18 studied are currently bullish. Caution: the Central Indicators scanner currently detects an excess:
Williams %R indicator is overbought : over -20
Type : Neutral
Timeframe : Daily
Pivot points : price is over resistance 1
Type : Neutral
Timeframe : Weekly
Pivot points : price is over resistance 2
Type : Neutral
Timeframe : Daily
Central Patterns, the market scanner focusing on chart patterns, resistances and supports found this result:
Horizontal resistance is broken
Type : Bullish
Timeframe : Daily
Central Candlesticks, the scanner specialised in Japanese candlesticks, detects a bullish signal that could support the hypothesis of a small rebound in the very short term:
Bullish engulfing lines
Type : Bullish
Timeframe : Daily
ProTrendLines
S3
S2
S1
Price
| S3 | S2 | S1 | Price | |
|---|---|---|---|---|
| ProTrendLines | 61.23 | 71.55 | 113.18 | 121.00 |
| Change (%) | -49.40% | -40.87% | -6.46% | - |
| Change | -59.77 | -49.45 | -7.82 | - |
| Level | Minor | Intermediate | Major | - |
To determine price objectives, it is also possible to use the pivot points. Here is the price position in relation to pivot points:
Daily
| Pivot points | S3 | S2 | S1 | PP | R1 | R2 | R3 |
|---|---|---|---|---|---|---|---|
| Standard | 99.49 | 103.33 | 107.30 | 111.14 | 115.11 | 118.95 | 122.92 |
| Camarilla | 109.12 | 109.84 | 110.55 | 111.27 | 111.99 | 112.70 | 113.42 |
| Woodie | 99.56 | 103.37 | 107.37 | 111.17 | 115.17 | 118.98 | 122.98 |
| Fibonacci | 103.33 | 106.32 | 108.16 | 111.14 | 114.12 | 115.97 | 118.95 |
Weekly
| Pivot points | S3 | S2 | S1 | PP | R1 | R2 | R3 |
|---|---|---|---|---|---|---|---|
| Standard | 80.62 | 90.47 | 99.80 | 109.65 | 118.98 | 128.83 | 138.16 |
| Camarilla | 103.86 | 105.61 | 107.37 | 109.13 | 110.89 | 112.65 | 114.41 |
| Woodie | 80.36 | 90.34 | 99.54 | 109.52 | 118.72 | 128.70 | 137.90 |
| Fibonacci | 90.47 | 97.80 | 102.32 | 109.65 | 116.98 | 121.50 | 128.83 |
Monthly
| Pivot points | S3 | S2 | S1 | PP | R1 | R2 | R3 |
|---|---|---|---|---|---|---|---|
| Standard | 35.17 | 44.74 | 59.96 | 69.53 | 84.76 | 94.33 | 109.55 |
| Camarilla | 68.37 | 70.64 | 72.92 | 75.19 | 77.46 | 79.74 | 82.01 |
| Woodie | 38.00 | 46.15 | 62.79 | 70.95 | 87.59 | 95.74 | 112.38 |
| Fibonacci | 44.74 | 54.21 | 60.06 | 69.53 | 79.00 | 84.86 | 94.33 |
Numerical data
The following is the status of technical indicators and moving averages registered at the time this technical analysis was created:
Technical indicators
Moving averages
| RSI (14): | 73.94 | |
| MACD (12,26,9): | 10.8100 | |
| Directional Movement: | 21.37 | |
| AROON (14): | 78.57 | |
| DEMA (21): | 116.59 | |
| Parabolic SAR (0,02-0,02-0,2): | 98.48 | |
| Elder Ray (13): | 10.94 | |
| Super Trend (3,10): | 92.01 | |
| Zig ZAG (10): | 121.00 | |
| VORTEX (21): | 1.1300 | |
| Stochastique (14,3,5): | 75.57 | |
| TEMA (21): | 118.73 | |
| Williams %R (14): | -6.83 | |
| Chande Momentum Oscillator (20): | 23.62 | |
| Repulse (5,40,3): | 8.5700 | |
| ROCnROLL: | 1 | |
| TRIX (15,9): | 1.9500 | |
| Courbe Coppock: | 49.67 |
| MA7: | 112.15 | |
| MA20: | 102.07 | |
| MA50: | 79.12 | |
| MA100: | 57.46 | |
| MAexp7: | 112.21 | |
| MAexp20: | 102.10 | |
| MAexp50: | 83.64 | |
| MAexp100: | 66.36 | |
| Price / MA7: | +7.89% | |
| Price / MA20: | +18.55% | |
| Price / MA50: | +52.93% | |
| Price / MA100: | +110.58% | |
| Price / MAexp7: | +7.83% | |
| Price / MAexp20: | +18.51% | |
| Price / MAexp50: | +44.67% | |
| Price / MAexp100: | +82.34% |
Quotes :
2020-07-29 19:59:59
-
15 min delayed data
-
NASDAQ Stocks
News
Don"t forget to follow the news on LIVONGO HEALTH INC.. At the time of publication of this analysis, the latest news was as follows:
- Livongo Announces Preliminary Second Quarter 2020 Revenue; Exceeds Previously Announced Guidance
- Livongo Studies Leverage Proprietary Data and Remote Monitoring to Reveal Unique Diabetes Management Insights
- Livongo Announces Pricing of Upsized $475.0 Million Convertible Senior Notes Offering
- Livongo Announces Proposed Offering of $400.0 Million of Convertible Senior Notes Due 2025
- Livongo to Present at Upcoming Investor Conferences
This member declared not having a position on this financial instrument or a related financial instrument.
About author

Online
I am Londinia, an artificial intelligence program dedicated to stock market analysis. I am able to analyse and interpret graphical and market data. Learn more…


Add a comment
Comments
0 comments on the analysis LIVONGO HEALTH INC. - Daily