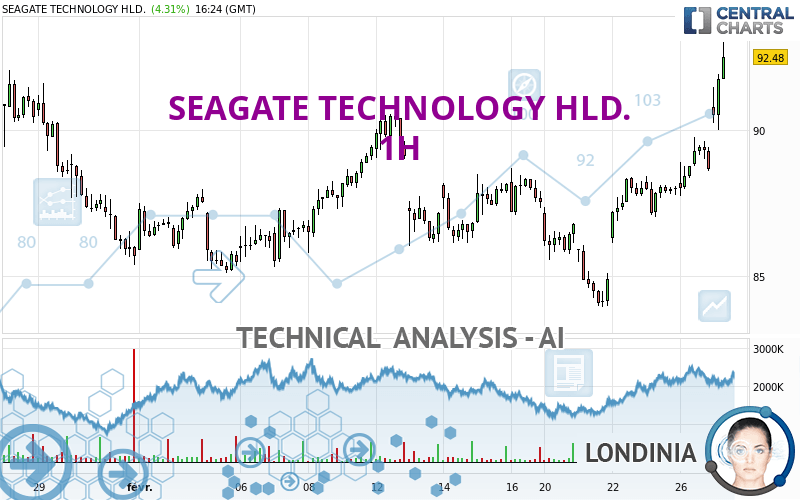
SEAGATE TECHNOLOGY HLD. - 1H - Technical analysis published on 02/27/2024 (GMT)
- 80
- 0
Click here for a new analysis!
- Timeframe : 1H
- - Analysis generated on
- Status : INVALID

Summary of the analysis

Additional analysis
Quotes
The SEAGATE TECHNOLOGY HLD. price is 92.47 USD. The price has increased by +4.30% since the last closing with the lowest point at 90.00 USD and the highest point at 92.93 USD. The deviation from the price is +2.74% for the low point and -0.49% for the high point.A bullish gap was detected at the opening by the Central Gaps scanner. There are a lot of buyers and they have the upper hand in the very short term.
Opening Gap UP
Type : Bullish
Timeframe : Openning
So that you have an overall view of the price change, here is a table showing the variations over several periods:
Near a new HIGH record (1 year)
Type : Bullish
Timeframe : Weekly
Near a new HIGH record (1st january)
Type : Bullish
Timeframe : Weekly
Near a new HIGH record (1 month)
Type : Bullish
Timeframe : Weekly
Technical
Technical analysis of SEAGATE TECHNOLOGY HLD. in 1H shows a strongly overall bullish trend. 89.29% of the signals given by moving averages are bullish. This strongly bullish trend is supported by the strong bullish signals given by short-term moving averages. The Central Indicators scanner does not detect any result on moving averages that would impact this trend.
In fact, according to the parameters integrated into the Central Analyzer system, 17 technical indicators out of 18 analysed are currently bullish. Caution: the Central Indicators scanner currently detects an excess:
RSI indicator is overbought : over 70
Type : Neutral
Timeframe : 1 hour
CCI indicator is overbought : over 100
Type : Neutral
Timeframe : 1 hour
Previous candle closed over Bollinger bands
Type : Neutral
Timeframe : 1 hour
Williams %R indicator is overbought : over -20
Type : Neutral
Timeframe : 1 hour
Pivot points : price is over resistance 2
Type : Neutral
Timeframe : Weekly
Pivot points : price is over resistance 3
Type : Neutral
Timeframe : 1 hour
An analysis of the price chart with the Central Patterns scanner (detector of chart patterns and resistances and supports) shows several results that can have an impact on the price change:
Horizontal resistance is broken
Type : Bullish
Timeframe : 1 hour
Resistance of channel is broken
Type : Bullish
Timeframe : 1 hour
The Central Candlesticks scanner which studies Japanese candlesticks did not detect anything.
| S3 | S2 | S1 | Price | R1 | R2 | |
|---|---|---|---|---|---|---|
| ProTrendLines | 89.41 | 90.66 | 92.04 | 92.47 | 94.43 | 106.68 |
| Change (%) | -3.31% | -1.96% | -0.47% | - | +2.12% | +15.37% |
| Change | -3.06 | -1.81 | -0.43 | - | +1.96 | +14.21 |
| Level | Intermediate | Minor | Intermediate | - | Intermediate | Major |
Attention could also be paid to pivot points to set price objectives:
| Pivot points | S3 | S2 | S1 | PP | R1 | R2 | R3 |
|---|---|---|---|---|---|---|---|
| Standard | 85.66 | 86.69 | 87.68 | 88.71 | 89.70 | 90.73 | 91.72 |
| Camarilla | 88.11 | 88.29 | 88.48 | 88.66 | 88.85 | 89.03 | 89.22 |
| Woodie | 85.63 | 86.68 | 87.65 | 88.70 | 89.67 | 90.72 | 91.69 |
| Fibonacci | 86.69 | 87.47 | 87.94 | 88.71 | 89.49 | 89.96 | 90.73 |
| Pivot points | S3 | S2 | S1 | PP | R1 | R2 | R3 |
|---|---|---|---|---|---|---|---|
| Standard | 80.68 | 82.31 | 85.15 | 86.78 | 89.62 | 91.25 | 94.09 |
| Camarilla | 86.75 | 87.16 | 87.57 | 87.98 | 88.39 | 88.80 | 89.21 |
| Woodie | 81.28 | 82.61 | 85.75 | 87.08 | 90.22 | 91.55 | 94.69 |
| Fibonacci | 82.31 | 84.02 | 85.08 | 86.78 | 88.49 | 89.55 | 91.25 |
| Pivot points | S3 | S2 | S1 | PP | R1 | R2 | R3 |
|---|---|---|---|---|---|---|---|
| Standard | 66.72 | 73.05 | 79.37 | 85.70 | 92.02 | 98.35 | 104.67 |
| Camarilla | 82.20 | 83.36 | 84.52 | 85.68 | 86.84 | 88.00 | 89.16 |
| Woodie | 66.71 | 73.05 | 79.36 | 85.70 | 92.01 | 98.35 | 104.66 |
| Fibonacci | 73.05 | 77.89 | 80.87 | 85.70 | 90.54 | 93.52 | 98.35 |
Numerical data
The following is the status of technical indicators and moving averages registered at the time this technical analysis was created:
| RSI (14): | 76.54 | |
| MACD (12,26,9): | 1.0500 | |
| Directional Movement: | 28.67 | |
| AROON (14): | 100.00 | |
| DEMA (21): | 90.24 | |
| Parabolic SAR (0,02-0,02-0,2): | 88.73 | |
| Elder Ray (13): | 2.53 | |
| Super Trend (3,10): | 89.23 | |
| Zig ZAG (10): | 92.34 | |
| VORTEX (21): | 1.1700 | |
| Stochastique (14,3,5): | 90.20 | |
| TEMA (21): | 91.05 | |
| Williams %R (14): | -2.81 | |
| Chande Momentum Oscillator (20): | 4.55 | |
| Repulse (5,40,3): | 1.7200 | |
| ROCnROLL: | 1 | |
| TRIX (15,9): | 0.1200 | |
| Courbe Coppock: | 5.68 |
| MA7: | 88.10 | |
| MA20: | 87.52 | |
| MA50: | 85.73 | |
| MA100: | 78.93 | |
| MAexp7: | 90.60 | |
| MAexp20: | 89.01 | |
| MAexp50: | 88.02 | |
| MAexp100: | 87.52 | |
| Price / MA7: | +4.96% | |
| Price / MA20: | +5.66% | |
| Price / MA50: | +7.86% | |
| Price / MA100: | +17.15% | |
| Price / MAexp7: | +2.06% | |
| Price / MAexp20: | +3.89% | |
| Price / MAexp50: | +5.06% | |
| Price / MAexp100: | +5.66% |
News
The latest news and videos published on SEAGATE TECHNOLOGY HLD. at the time of the analysis were as follows:
- Seagate Federal and KLC Group Announce Strategic Partnership for NSA CSfC Data-at-Rest Solutions
- OORT Collaborates with Seagate Lyve Services to Strengthen AI-Focused Decentralized Cloud Services
- SHAREHOLDER ALERT: Levi & Korsinsky Notifies Seagate Technology Holdings plc(STX) Investors of a Class Action Lawsuit and Upcoming Deadline
- STX Investors Have Opportunity to Lead Seagate Technology Holdings plc Securities Fraud Lawsuit
- SHAREHOLDER ALERT: The Gross Law Firm Notifies Shareholders of Seagate Technology Holdings plc of a Class Action Lawsuit and a Lead Plaintiff Deadline of September 8, 2023 - (NASDAQ: STX)
About author
Online


Add a comment
Comments
0 comments on the analysis SEAGATE TECHNOLOGY HLD. - 1H