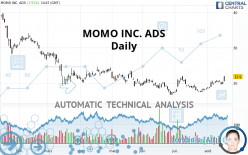
HELLO GROUP INC. ADS - Daily - Technical analysis published on 08/18/2020 (GMT)
- Who voted?
- 181
- 0
Click here for a new analysis!
- Timeframe : Daily
- - Analysis generated on
- Status : INVALID
Summary of the analysis

Additional analysis
Quotes
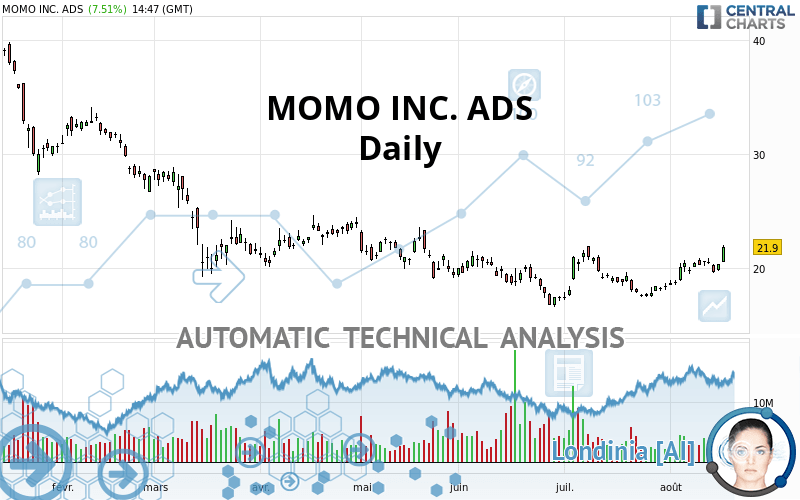
The MOMO INC. ADS price is 21.90 USD. On the day, this instrument gained +7.51% and was between 20.51 USD and 22.05 USD. This implies that the price is at +6.78% from its lowest and at -0.68% from its highest.A bullish gap was detected at the opening by the Central Gaps scanner. There are a lot of buyers and they have the upper hand in the very short term.
Opening Gap UP
Type : Bullish
Timeframe : Openning
Here is a more detailed summary of the historical variations registered by MOMO INC. ADS:
Technical
A technical analysis in Daily of this MOMO INC. ADS chart shows a slightly bullish trend. Only 53.57% of the signals given by moving averages are bullish. This slightly bullish trend is reinforced by the strong signals currently being given by short-term moving averages. The Central Indicators scanner detects bullish signals on moving averages that could impact this trend:
Bullish price crossover with adaptative moving average 20
Type : Bullish
Timeframe : Daily
Bullish price crossover with adaptative moving average 100
Type : Bullish
Timeframe : Daily
In fact, 16 technical indicators on 18 studied are currently positioned bullish. Caution: the Central Indicators scanner currently detects an excess:
Williams %R indicator is overbought : over -20
Type : Neutral
Timeframe : Daily
Pivot points : price is over resistance 3
Type : Neutral
Timeframe : Daily
Pivot points : price is over resistance 3
Type : Neutral
Timeframe : Weekly
Price is back under the pivot point
Type : Bearish
Timeframe : Weekly
Central Patterns, the market scanner focusing on chart patterns, resistances and supports found these results:
Horizontal resistance is broken
Type : Bullish
Timeframe : Daily
Resistance of channel is broken
Type : Bullish
Timeframe : Daily
Resistance of triangle is broken
Type : Bullish
Timeframe : Daily
The Central Candlesticks scanner which studies Japanese candlesticks did not detect anything.
| S2 | S1 | Price | R1 | R2 | R3 | |
|---|---|---|---|---|---|---|
| ProTrendLines | 16.91 | 20.58 | 21.90 | 23.34 | 30.98 | 35.95 |
| Change (%) | -22.79% | -6.03% | - | +6.58% | +41.46% | +64.16% |
| Change | -4.99 | -1.32 | - | +1.44 | +9.08 | +14.05 |
| Level | Major | Intermediate | - | Minor | Intermediate | Minor |
Attention could also be paid to pivot points to set price objectives:
| Pivot points | S3 | S2 | S1 | PP | R1 | R2 | R3 |
|---|---|---|---|---|---|---|---|
| Standard | 19.35 | 19.56 | 19.97 | 20.18 | 20.59 | 20.80 | 21.21 |
| Camarilla | 20.20 | 20.26 | 20.31 | 20.37 | 20.43 | 20.48 | 20.54 |
| Woodie | 19.44 | 19.61 | 20.06 | 20.23 | 20.68 | 20.85 | 21.30 |
| Fibonacci | 19.56 | 19.80 | 19.95 | 20.18 | 20.42 | 20.57 | 20.80 |
| Pivot points | S3 | S2 | S1 | PP | R1 | R2 | R3 |
|---|---|---|---|---|---|---|---|
| Standard | 17.90 | 18.75 | 19.23 | 20.08 | 20.56 | 21.41 | 21.89 |
| Camarilla | 19.34 | 19.47 | 19.59 | 19.71 | 19.83 | 19.95 | 20.08 |
| Woodie | 17.72 | 18.66 | 19.05 | 19.99 | 20.38 | 21.32 | 21.71 |
| Fibonacci | 18.75 | 19.26 | 19.57 | 20.08 | 20.59 | 20.90 | 21.41 |
| Pivot points | S3 | S2 | S1 | PP | R1 | R2 | R3 |
|---|---|---|---|---|---|---|---|
| Standard | 11.72 | 14.48 | 16.47 | 19.23 | 21.22 | 23.98 | 25.97 |
| Camarilla | 17.16 | 17.60 | 18.04 | 18.47 | 18.91 | 19.34 | 19.78 |
| Woodie | 11.35 | 14.29 | 16.10 | 19.04 | 20.85 | 23.79 | 25.60 |
| Fibonacci | 14.48 | 16.29 | 17.41 | 19.23 | 21.04 | 22.16 | 23.98 |
Numerical data
The following is the status of the technical indicators and moving averages at the time of publication of this technical analysis:
| RSI (14): | 61.78 | |
| MACD (12,26,9): | 0.4200 | |
| Directional Movement: | 17.36 | |
| AROON (14): | 92.86 | |
| DEMA (21): | 20.22 | |
| Parabolic SAR (0,02-0,02-0,2): | 18.71 | |
| Elder Ray (13): | 0.89 | |
| Super Trend (3,10): | 18.58 | |
| Zig ZAG (10): | 21.25 | |
| VORTEX (21): | 1.0300 | |
| Stochastique (14,3,5): | 81.12 | |
| TEMA (21): | 20.74 | |
| Williams %R (14): | -1.49 | |
| Chande Momentum Oscillator (20): | 2.81 | |
| Repulse (5,40,3): | 5.1100 | |
| ROCnROLL: | 1 | |
| TRIX (15,9): | 0.1600 | |
| Courbe Coppock: | 25.02 |
| MA7: | 20.52 | |
| MA20: | 19.27 | |
| MA50: | 19.25 | |
| MA100: | 20.49 | |
| MAexp7: | 20.50 | |
| MAexp20: | 19.77 | |
| MAexp50: | 19.80 | |
| MAexp100: | 21.36 | |
| Price / MA7: | +6.73% | |
| Price / MA20: | +13.65% | |
| Price / MA50: | +13.77% | |
| Price / MA100: | +6.88% | |
| Price / MAexp7: | +6.83% | |
| Price / MAexp20: | +10.77% | |
| Price / MAexp50: | +10.61% | |
| Price / MAexp100: | +2.53% |
News
The last news published on MOMO INC. ADS at the time of the generation of this analysis was as follows:
- Momo Announces Unaudited Financial Results for the Third Quarter of 2019
- Momo to Report Third Quarter 2019 Results on November 26, 2019
- Momo Announces Unaudited Financial Results for the Second Quarter of 2019
- Momo to Report Second Quarter 2019 Results on August 27, 2019
- Hagens Berman Reminds Momo Inc. (MOMO) Investors of Lead Plaintiff Deadline, Encourages Investors Who Suffered $50,000+ Losses to Contact the Firm
About author

Online


Add a comment
Comments
0 comments on the analysis HELLO GROUP INC. ADS - Daily