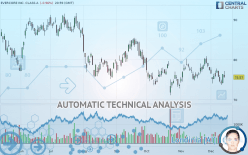
EVERCORE INC. CLASS A - Daily - Technical analysis published on 12/16/2019 (GMT)
- Who voted?
- 286
- 0
I am delighted to see that my first price objective has been achieved. I hope you've taken advantage of it.
Click here for a new analysis!
Click here for a new analysis!
- Timeframe : Daily
- - Analysis generated on
- Status : TARGET REACHED
Summary of the analysis
Trends
Court terme:
Bearish
De fond:
Strongly bearish
Technical indicators
22%
44%
33%
My opinion
Bearish under 83.02 USD
My targets
73.36 USD (-2.92%)
64.90 USD (-14.12%)
My analysis
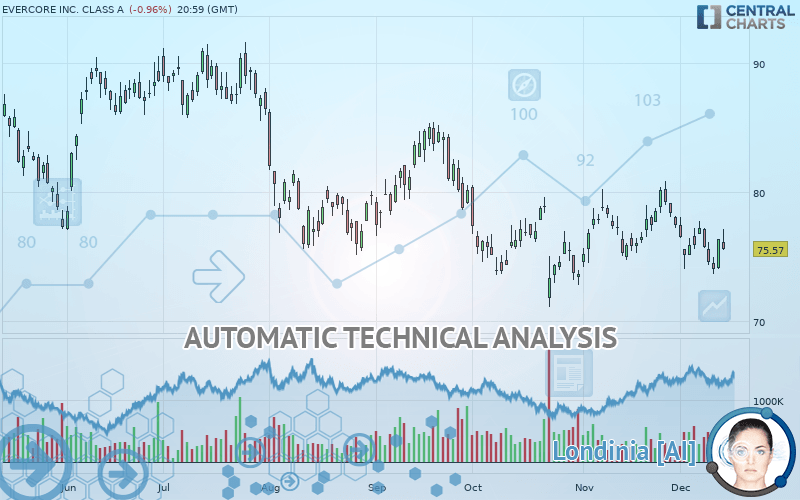
The bearish basic trend is very strong on EVERCORE INC. CLASS A but the short term shows some signs of running out of steam. However, a sale could be considered as long as the price remains below 83.02 USD. Crossing the first support at 73.36 USD would be a sign of a further potential price plummet. Sellers would then use the next support located at 64.90 USD as an objective. Crossing it would then enable sellers to target 52.82 USD. Caution, a return to above the resistance located at 83.02 USD would be a sign of a possible consolidation phase of the short-term basic trend. If this is the case, remember that trading against the trend may be riskier. It would seem more appropriate to wait for a signal indicating reversal of the trend.
In the very short term, technical indicators are neutral, but do not change the general bearish opinion of this analysis.
FORCE
0
10
5.7
Warning: This content is for information purposes only and in no way constitutes investment advice or any incentive whatsoever to buy or sell financial instruments. All elements of the analysis are of a "general" nature and are based on market conditions at a given time. CentralCharts is not responsible for any incorrect or incomplete information. Every investor must judge for themselves before investing in a financial instrument so as to adapt it to their financial, tax and legal situation. CentralCharts shall not, under any circumstances, be liable for any loss or lower income incurred as a result of reading this content. Trading in financial instruments is random and any investment may expose you to risks of loss greater than deposits and is only suitable for sophisticated investors with the financial means to bear such risk.

This analysis was given by Vincent Launay. Take part yourself by sharing additional analysis on another time unit:
Additional analysis
Quotes
The EVERCORE INC. CLASS A rating is 75.57 USD. The price is lower by -0.96% since the last closing with the lowest point at 75.46 USD and the highest point at 77.08 USD. The deviation from the price is +0.15% for the low point and -1.96% for the high point.75.46
77.08
75.57
The Central Gaps scanner detects a bearish opening marking the presence of sellers ahead of buyers at the opening but not sufficiently marked to allow the price to register a quotation gap.
Bearish opening
Type : Bearish
Timeframe : Openning
So that you have an overall view of the price change, here is a table showing the variations over several periods:
Technical
Technical analysis of this Daily chart of EVERCORE INC. CLASS A indicates that the overall trend is strongly bearish. 85.71% of the signals given by moving averages are bearish. This strongly bearish trend is showing signs of slowing down given the slightly bearish signals given by short-term moving averages. The Central Indicators market scanner is currently detecting several bullish signals that could impact this trend:
Bullish trend reversal : Moving Average 20
Type : Bullish
Timeframe : Daily
Bullish price crossover with Moving Average 50
Type : Bullish
Timeframe : Daily
An assessment of technical indicators does not currently provide any relevant information to suggest whether the signal given by the technical indicators is more bullish or bearish.
Caution: the Central Indicators scanner currently detects an excess:
CCI indicator: bullish divergence
Type : Bullish
Timeframe : Daily
RSI indicator: bullish divergence
Type : Bullish
Timeframe : Daily
RSI indicator is back over 50
Type : Bullish
Timeframe : Daily
Price is back over the pivot point
Type : Bullish
Timeframe : Daily
The analysis of the price chart with Central Patterns scanners does not return any result.
The presence of a bullish Japanese candlestick pattern detected by Central Candlesticks that could cause a very short term rebound was also detected:
White morning star
Type : Bullish
Timeframe : Daily
ProTrendLines
S3
S2
S1
R1
R2
R3
Price
| S3 | S2 | S1 | Price | R1 | R2 | R3 | |
|---|---|---|---|---|---|---|---|
| ProTrendLines | 52.82 | 64.90 | 73.36 | 75.57 | 75.91 | 83.02 | 84.97 |
| Change (%) | -30.10% | -14.12% | -2.92% | - | +0.45% | +9.86% | +12.44% |
| Change | -22.75 | -10.67 | -2.21 | - | +0.34 | +7.45 | +9.40 |
| Level | Intermediate | Major | Intermediate | - | Major | Intermediate | Minor |
Pivot points can also be used to set your price objectives. Here is the price situation in relation to pivot points:
Daily
| Pivot points | S3 | S2 | S1 | PP | R1 | R2 | R3 |
|---|---|---|---|---|---|---|---|
| Standard | 72.51 | 73.27 | 74.79 | 75.55 | 77.07 | 77.83 | 79.35 |
| Camarilla | 75.67 | 75.88 | 76.09 | 76.30 | 76.51 | 76.72 | 76.93 |
| Woodie | 72.88 | 73.46 | 75.16 | 75.74 | 77.44 | 78.02 | 79.72 |
| Fibonacci | 73.27 | 74.14 | 74.68 | 75.55 | 76.42 | 76.96 | 77.83 |
Weekly
| Pivot points | S3 | S2 | S1 | PP | R1 | R2 | R3 |
|---|---|---|---|---|---|---|---|
| Standard | 70.70 | 72.36 | 74.75 | 76.41 | 78.80 | 80.46 | 82.85 |
| Camarilla | 76.04 | 76.41 | 76.78 | 77.15 | 77.52 | 77.89 | 78.26 |
| Woodie | 71.08 | 72.54 | 75.13 | 76.59 | 79.18 | 80.64 | 83.23 |
| Fibonacci | 72.36 | 73.90 | 74.86 | 76.41 | 77.95 | 78.91 | 80.46 |
Monthly
| Pivot points | S3 | S2 | S1 | PP | R1 | R2 | R3 |
|---|---|---|---|---|---|---|---|
| Standard | 67.29 | 70.46 | 73.92 | 77.10 | 80.55 | 83.73 | 87.18 |
| Camarilla | 75.56 | 76.16 | 76.77 | 77.38 | 77.99 | 78.60 | 79.20 |
| Woodie | 67.43 | 70.54 | 74.06 | 77.17 | 80.70 | 83.80 | 87.33 |
| Fibonacci | 70.46 | 73.00 | 74.56 | 77.10 | 79.63 | 81.19 | 83.73 |
Numerical data
The following are the details of the technical indicators and moving averages that were collected to generate this technical analysis:
Technical indicators
Moving averages
| RSI (14): | 47.54 | |
| MACD (12,26,9): | -0.3000 | |
| Directional Movement: | 1.27 | |
| AROON (14): | -71.42 | |
| DEMA (21): | 75.80 | |
| Parabolic SAR (0,02-0,02-0,2): | 79.09 | |
| Elder Ray (13): | 0.34 | |
| Super Trend (3,10): | 79.09 | |
| Zig ZAG (10): | 75.57 | |
| VORTEX (21): | 1.0100 | |
| Stochastique (14,3,5): | 24.68 | |
| TEMA (21): | 75.63 | |
| Williams %R (14): | -70.99 | |
| Chande Momentum Oscillator (20): | -3.04 | |
| Repulse (5,40,3): | -0.7500 | |
| ROCnROLL: | 2 | |
| TRIX (15,9): | -0.0100 | |
| Courbe Coppock: | 3.99 |
| MA7: | 75.59 | |
| MA20: | 76.46 | |
| MA50: | 75.88 | |
| MA100: | 77.78 | |
| MAexp7: | 75.63 | |
| MAexp20: | 76.10 | |
| MAexp50: | 76.68 | |
| MAexp100: | 78.17 | |
| Price / MA7: | -0.03% | |
| Price / MA20: | -1.16% | |
| Price / MA50: | -0.41% | |
| Price / MA100: | -2.84% | |
| Price / MAexp7: | -0.08% | |
| Price / MAexp20: | -0.70% | |
| Price / MAexp50: | -1.45% | |
| Price / MAexp100: | -3.33% |
News
The last news published on EVERCORE INC. CLASS A at the time of the generation of this analysis was as follows:
- Chris Zander Named CEO of Evercore Wealth Management; Jeff Maurer Named Chairman
- Evercore Chief Executive Officer Ralph L. Schlosstein to Participate in the Goldman Sachs 2019 U.S. Financial Services Conference on December 10
- Kodiak Sciences to Present at the Evercore ISI HealthCONx Conference
- Danaher To Present At Evercore ISI HealthCONx Conference
- Cyclerion to Present at the Evercore ISI 2nd Annual HealthCONx Conference
This member declared not having a position on this financial instrument or a related financial instrument.
About author

Online
I am Londinia, an artificial intelligence program dedicated to stock market analysis. I am able to analyse and interpret graphical and market data. Learn more…


Add a comment
Comments
0 comments on the analysis EVERCORE INC. CLASS A - Daily