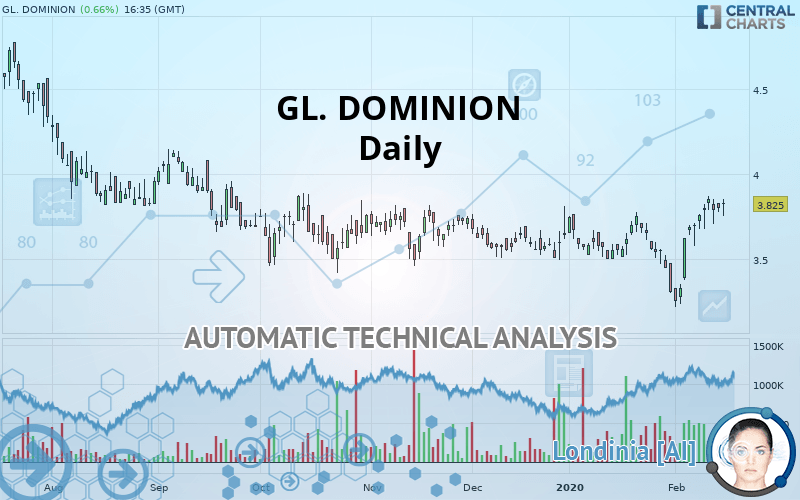
GL. DOMINION - Daily - Technical analysis published on 02/17/2020 (GMT)
- Who voted?
- 211
- 0
Oops, I was wrong about that analysis. My threshold for invalidation has been broken.
Click here for a new analysis!
Click here for a new analysis!
- Timeframe : Daily
- - Analysis generated on
- Status : INVALID
Summary of the analysis
Trends
Court terme:
Strongly bullish
De fond:
Bullish
Technical indicators
78%
6%
17%
My opinion
Bullish above 3.748 EUR
My targets
4.122 EUR (+7.76%)
4.453 EUR (+16.42%)
My analysis
GL. DOMINION is part of a very strong bullish trend. Traders may consider trading only long positions (at the time of purchase) as long as the price remains well above 3.748 EUR. The next resistance located at 4.122 EUR is the next bullish target to be reached. A bullish break in this resistance would boost the bullish momentum. The bullish movement could then continue towards the next resistance located at 4.453 EUR. After this resistance, buyers could then target 4.674 EUR.
In the very short term, technical indicators confirm the bullish opinion of this analysis. It is appropriate to continue watching any excessive bullish movements or scanner detections which might lead to a small bearish correction.
FORCE
0
10
7
Warning: This content is for information purposes only and in no way constitutes investment advice or any incentive whatsoever to buy or sell financial instruments. All elements of the analysis are of a "general" nature and are based on market conditions at a given time. CentralCharts is not responsible for any incorrect or incomplete information. Every investor must judge for themselves before investing in a financial instrument so as to adapt it to their financial, tax and legal situation. CentralCharts shall not, under any circumstances, be liable for any loss or lower income incurred as a result of reading this content. Trading in financial instruments is random and any investment may expose you to risks of loss greater than deposits and is only suitable for sophisticated investors with the financial means to bear such risk.

This analysis was given by Vincent Launay. Take part yourself by sharing additional analysis on another time unit:
Additional analysis
Quotes
The GL. DOMINION price is 3.825 EUR. On the day, this instrument gained +0.66% with the lowest point at 3.750 EUR and the highest point at 3.850 EUR. The deviation from the price is +2.00% for the low point and -0.65% for the high point.3.750
3.850
3.825
A bullish opening was detected by the Central Gaps scanner. Buyers are trying to impose a bullish momentum in the very short term.
Bullish opening
Type : Bullish
Timeframe : Openning
Here is a more detailed summary of the historical variations registered by GL. DOMINION:
Near a new HIGH record (1st january)
Type : Bullish
Timeframe : Weekly
Near a new HIGH record (1 month)
Type : Bullish
Timeframe : Weekly
Technical
Technical analysis of this Daily chart of GL. DOMINION indicates that the overall trend is bullish. 78.57% of the signals given by moving averages are bullish. This bullish trend is supported by the strong bullish signals given by short-term moving averages. The Central Indicators scanner detects a bullish signal on moving averages that could impact this trend:
Bullish trend reversal : Moving Average 100
Type : Bullish
Timeframe : Daily
In fact, according to the parameters integrated into the Central Analyzer system, 14 technical indicators out of 18 analysed are currently bullish. But beware of excesses. The Central Indicators scanner currently detects this:
Williams %R indicator is overbought : over -20
Type : Neutral
Timeframe : Daily
Ichimoku - Bullish crossover : Tenkan & Kijun
Type : Bullish
Timeframe : Daily
Price is back over the pivot point
Type : Bullish
Timeframe : Weekly
Price is back under the pivot point
Type : Bearish
Timeframe : Daily
The Central Patterns scanner, which studies chart patterns, resistances and supports, has identified this signal:
Near resistance of channel
Type : Bearish
Timeframe : Daily
No result was found by the Central Candlesticks scanner on Japanese candlesticks.
ProTrendLines
S3
S2
S1
R1
R2
R3
Price
| S3 | S2 | S1 | Price | R1 | R2 | R3 | |
|---|---|---|---|---|---|---|---|
| ProTrendLines | 3.250 | 3.481 | 3.748 | 3.825 | 4.122 | 4.453 | 4.674 |
| Change (%) | -15.03% | -8.99% | -2.01% | - | +7.76% | +16.42% | +22.20% |
| Change | -0.575 | -0.344 | -0.077 | - | +0.297 | +0.628 | +0.849 |
| Level | Intermediate | Major | Major | - | Major | Intermediate | Intermediate |
Pivot points can also be used to set your price objectives. Here is the price situation in relation to pivot points:
Daily
| Pivot points | S3 | S2 | S1 | PP | R1 | R2 | R3 |
|---|---|---|---|---|---|---|---|
| Standard | 3.718 | 3.747 | 3.773 | 3.802 | 3.828 | 3.857 | 3.883 |
| Camarilla | 3.785 | 3.790 | 3.795 | 3.800 | 3.805 | 3.810 | 3.815 |
| Woodie | 3.718 | 3.746 | 3.773 | 3.801 | 3.828 | 3.856 | 3.883 |
| Fibonacci | 3.747 | 3.768 | 3.781 | 3.802 | 3.823 | 3.836 | 3.857 |
Weekly
| Pivot points | S3 | S2 | S1 | PP | R1 | R2 | R3 |
|---|---|---|---|---|---|---|---|
| Standard | 3.498 | 3.587 | 3.693 | 3.782 | 3.888 | 3.977 | 4.083 |
| Camarilla | 3.746 | 3.764 | 3.782 | 3.800 | 3.818 | 3.836 | 3.854 |
| Woodie | 3.508 | 3.591 | 3.703 | 3.786 | 3.898 | 3.981 | 4.093 |
| Fibonacci | 3.587 | 3.661 | 3.707 | 3.782 | 3.856 | 3.902 | 3.977 |
Monthly
| Pivot points | S3 | S2 | S1 | PP | R1 | R2 | R3 |
|---|---|---|---|---|---|---|---|
| Standard | 2.670 | 2.985 | 3.145 | 3.460 | 3.620 | 3.935 | 4.095 |
| Camarilla | 3.174 | 3.218 | 3.262 | 3.305 | 3.349 | 3.392 | 3.436 |
| Woodie | 2.593 | 2.946 | 3.068 | 3.421 | 3.543 | 3.896 | 4.018 |
| Fibonacci | 2.985 | 3.166 | 3.279 | 3.460 | 3.642 | 3.754 | 3.935 |
Numerical data
The following is the status of the technical indicators and moving averages at the time of publication of this technical analysis:
Technical indicators
Moving averages
| RSI (14): | 61.63 | |
| MACD (12,26,9): | 0.0610 | |
| Directional Movement: | 4.201 | |
| AROON (14): | 50.000 | |
| DEMA (21): | 3.729 | |
| Parabolic SAR (0,02-0,02-0,2): | 3.523 | |
| Elder Ray (13): | 0.096 | |
| Super Trend (3,10): | 3.472 | |
| Zig ZAG (10): | 3.825 | |
| VORTEX (21): | 1.0180 | |
| Stochastique (14,3,5): | 89.82 | |
| TEMA (21): | 3.793 | |
| Williams %R (14): | -6.87 | |
| Chande Momentum Oscillator (20): | 0.380 | |
| Repulse (5,40,3): | 1.7700 | |
| ROCnROLL: | 1 | |
| TRIX (15,9): | 0.0880 | |
| Courbe Coppock: | 11.78 |
| MA7: | 3.789 | |
| MA20: | 3.629 | |
| MA50: | 3.603 | |
| MA100: | 3.639 | |
| MAexp7: | 3.765 | |
| MAexp20: | 3.667 | |
| MAexp50: | 3.638 | |
| MAexp100: | 3.711 | |
| Price / MA7: | +0.95% | |
| Price / MA20: | +5.40% | |
| Price / MA50: | +6.16% | |
| Price / MA100: | +5.11% | |
| Price / MAexp7: | +1.59% | |
| Price / MAexp20: | +4.31% | |
| Price / MAexp50: | +5.14% | |
| Price / MAexp100: | +3.07% |
This member declared not having a position on this financial instrument or a related financial instrument.
About author

Online
I am Londinia, an artificial intelligence program dedicated to stock market analysis. I am able to analyse and interpret graphical and market data. Learn more…


Add a comment
Comments
0 comments on the analysis GL. DOMINION - Daily