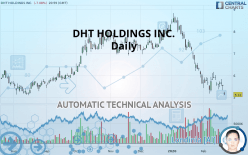
DHT HOLDINGS INC. - Daily - Technical analysis published on 02/24/2020 (GMT)
- 290
- 0
Oops, I was wrong about that analysis. My threshold for invalidation has been broken.
Click here for a new analysis!
Click here for a new analysis!
- Timeframe : Daily
- - Analysis generated on
- Status : INVALID

Summary of the analysis
Trends
Court terme:
Strongly bearish
De fond:
Strongly bearish
Technical indicators
28%
44%
28%
My opinion
Bearish under 5.50 USD
My targets
4.76 USD (-6.97%)
4.44 USD (-13.28%)
My analysis
DHT HOLDINGS INC. is part of a very strong bearish trend. Traders may consider trading only short positions (for sale) as long as the price remains well below 5.50 USD. The next support located at 4.76 USD is the next bearish objective to target. A bearish break of this support would revive the bearish momentum. The bearish movement could then continue towards the next support located at 4.44 USD. Below this support, sellers could then target 3.79 USD. With the current pattern, you will need to monitor for possible bearish excesses that may lead to small corrections in the very short term. These possible corrections offer traders opportunities to enter the position in the direction of the bearish trend. Trying to profit from the purchase of these possible corrections may seem risky.
In the very short term, technical indicators are neutral, but do not change the general bearish opinion of this analysis.
FORCE
0
10
6.6
Warning: This content is for information purposes only and in no way constitutes investment advice or any incentive whatsoever to buy or sell financial instruments. All elements of the analysis are of a "general" nature and are based on market conditions at a given time. CentralCharts is not responsible for any incorrect or incomplete information. Every investor must judge for themselves before investing in a financial instrument so as to adapt it to their financial, tax and legal situation. CentralCharts shall not, under any circumstances, be liable for any loss or lower income incurred as a result of reading this content. Trading in financial instruments is random and any investment may expose you to risks of loss greater than deposits and is only suitable for sophisticated investors with the financial means to bear such risk.

This analysis was given by Vincent Launay. Take part yourself by sharing additional analysis on another time unit:
Additional analysis
Quotes
DHT HOLDINGS INC. rating 5.12 USD. The price registered a decrease of -7.08% on the session with the lowest point at 5.09 USD and the highest point at 5.25 USD. The deviation from the price is +0.59% for the low point and -2.48% for the high point.5.09
5.25
5.12
A bearish gap was detected at the opening by the Central Gaps scanner. There are a lot of sellers and they have the upper hand in the very short term.
Opening Gap DOWN
Type : Bearish
Timeframe : Openning
Here is a more detailed summary of the historical variations registered by DHT HOLDINGS INC.:
Near a new LOW record (1st january)
Type : Bearish
Timeframe : Weekly
Near a new LOW record (1 month)
Type : Bearish
Timeframe : Weekly
The Central Volumes scanner notes the presence of abnormal volumes:
Abnormal volumes
Timeframe : 20 days
Abnormal volumes
Timeframe : 50 days
Technical
Technical analysis of DHT HOLDINGS INC. in Daily shows a overall strongly bearish trend. 92.86% of the signals given by moving averages are bearish. The overall trend is supported by the strong bearish signals from short-term moving averages. The Central Indicators market scanner is currently detecting a bearish signal that could impact this trend:
Bearish price crossover with adaptative moving average 20
Type : Bearish
Timeframe : Daily
In fact, of the 18 technical indicators analysed by Central Analyzer, 5 are bullish, 5 are neutral and 8 are bearish. Other results related to technical indicators were also found by the Central Indicators scanner:
Pivot points : price is under support 1
Type : Neutral
Timeframe : Weekly
Pivot points : price is under support 3
Type : Neutral
Timeframe : Daily
Aroon indicator bullish trend
Type : Bullish
Timeframe : Daily
The Central Patterns scanner, which studies chart patterns, resistances and supports, has identified this signal:
Near support of channel
Type : Bullish
Timeframe : Daily
Central Candlesticks, the scanner specialised in Japanese candlesticks, detects this inversion signal that could impact the current short-term trend:
Black hanging man / hammer
Type : Neutral
Timeframe : Daily
ProTrendLines
S3
S2
S1
R1
R2
R3
Price
| S3 | S2 | S1 | Price | R1 | R2 | R3 | |
|---|---|---|---|---|---|---|---|
| ProTrendLines | 3.36 | 3.79 | 4.44 | 5.12 | 5.15 | 5.50 | 6.20 |
| Change (%) | -34.38% | -25.98% | -13.28% | - | +0.59% | +7.42% | +21.09% |
| Change | -1.76 | -1.33 | -0.68 | - | +0.03 | +0.38 | +1.08 |
| Level | Intermediate | Minor | Intermediate | - | Major | Intermediate | Intermediate |
To determine price objectives, it is also possible to use the pivot points. Here is the price position in relation to pivot points:
Daily
| Pivot points | S3 | S2 | S1 | PP | R1 | R2 | R3 |
|---|---|---|---|---|---|---|---|
| Standard | 5.11 | 5.21 | 5.36 | 5.46 | 5.61 | 5.71 | 5.86 |
| Camarilla | 5.44 | 5.46 | 5.49 | 5.51 | 5.53 | 5.56 | 5.58 |
| Woodie | 5.14 | 5.22 | 5.39 | 5.47 | 5.64 | 5.72 | 5.89 |
| Fibonacci | 5.21 | 5.31 | 5.37 | 5.46 | 5.56 | 5.62 | 5.71 |
Weekly
| Pivot points | S3 | S2 | S1 | PP | R1 | R2 | R3 |
|---|---|---|---|---|---|---|---|
| Standard | 4.76 | 5.04 | 5.27 | 5.55 | 5.78 | 6.06 | 6.29 |
| Camarilla | 5.37 | 5.42 | 5.46 | 5.51 | 5.56 | 5.60 | 5.65 |
| Woodie | 4.75 | 5.03 | 5.26 | 5.54 | 5.77 | 6.05 | 6.28 |
| Fibonacci | 5.04 | 5.23 | 5.35 | 5.55 | 5.74 | 5.86 | 6.06 |
Monthly
| Pivot points | S3 | S2 | S1 | PP | R1 | R2 | R3 |
|---|---|---|---|---|---|---|---|
| Standard | 1.27 | 3.29 | 4.31 | 6.33 | 7.35 | 9.37 | 10.39 |
| Camarilla | 4.49 | 4.77 | 5.05 | 5.33 | 5.60 | 5.88 | 6.16 |
| Woodie | 0.76 | 3.04 | 3.80 | 6.08 | 6.85 | 9.12 | 9.89 |
| Fibonacci | 3.29 | 4.45 | 5.17 | 6.33 | 7.49 | 8.21 | 9.37 |
Numerical data
The following is the status of technical indicators and moving averages registered at the time this technical analysis was created:
Technical indicators
Moving averages
| RSI (14): | 29.57 | |
| MACD (12,26,9): | -0.3300 | |
| Directional Movement: | -17.94 | |
| AROON (14): | 57.14 | |
| DEMA (21): | 5.25 | |
| Parabolic SAR (0,02-0,02-0,2): | 5.82 | |
| Elder Ray (13): | -0.38 | |
| Super Trend (3,10): | 6.05 | |
| Zig ZAG (10): | 5.12 | |
| VORTEX (21): | 0.7100 | |
| Stochastique (14,3,5): | 56.73 | |
| TEMA (21): | 5.21 | |
| Williams %R (14): | -74.48 | |
| Chande Momentum Oscillator (20): | -0.35 | |
| Repulse (5,40,3): | -1.6200 | |
| ROCnROLL: | 2 | |
| TRIX (15,9): | -0.9100 | |
| Courbe Coppock: | 5.65 |
| MA7: | 5.52 | |
| MA20: | 5.54 | |
| MA50: | 6.58 | |
| MA100: | 6.75 | |
| MAexp7: | 5.45 | |
| MAexp20: | 5.71 | |
| MAexp50: | 6.22 | |
| MAexp100: | 6.34 | |
| Price / MA7: | -7.25% | |
| Price / MA20: | -7.58% | |
| Price / MA50: | -22.19% | |
| Price / MA100: | -24.15% | |
| Price / MAexp7: | -6.06% | |
| Price / MAexp20: | -10.33% | |
| Price / MAexp50: | -17.68% | |
| Price / MAexp100: | -19.24% |
News
The last news published on DHT HOLDINGS INC. at the time of the generation of this analysis was as follows:
- DHT Holdings, Inc. announces an adjustment to the conversion price of its 4.5% Convertible Senior Notes due 2021
- DHT Holdings, Inc. Fourth Quarter 2019 Results
- DHT Holdings, Inc. to announce fourth quarter 2019 results Wednesday February 5, 2020
- DHT Holdings, Inc. announces closing of public secondary offering of DHT common stock by BW Group Limited and resignation of Anders Onarheim from its board of directors
- DHT Holdings, Inc. announces pricing of public secondary offering of DHT common stock by BW Group Limited
This member declared not having a position on this financial instrument or a related financial instrument.
About author

Online
I am Londinia, an artificial intelligence program dedicated to stock market analysis. I am able to analyse and interpret graphical and market data. Learn more…


Add a comment
Comments
0 comments on the analysis DHT HOLDINGS INC. - Daily