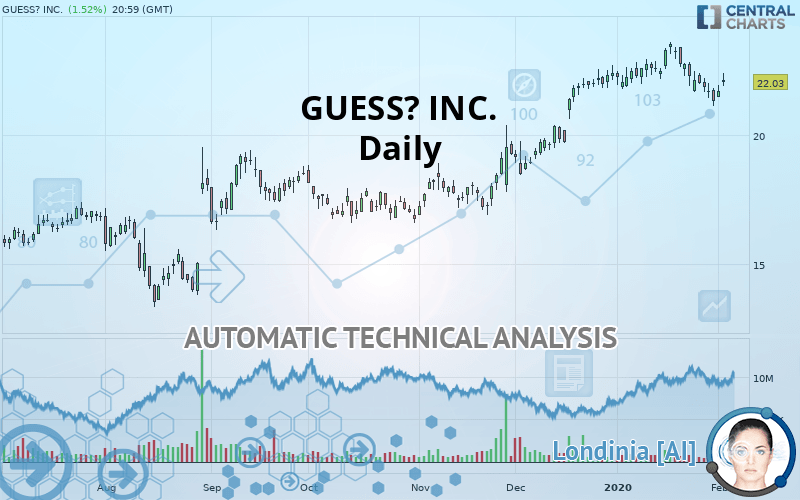
GUESS? INC. - Daily - Technical analysis published on 02/05/2020 (GMT)
- Who voted?
- 256
- 0
Oops, I was wrong about that analysis. My threshold for invalidation has been broken.
Click here for a new analysis!
Click here for a new analysis!
- Timeframe : Daily
- - Analysis generated on
- Status : INVALID
Summary of the analysis
Trends
Court terme:
Neutral
De fond:
Bullish
Technical indicators
22%
33%
44%
My opinion
Bullish above 20.63 USD
My targets
23.79 USD (+7.99%)
25.90 USD (+17.57%)
My analysis
We are currently in a phase of short-term indecision. In a case like this, you could favour trades in the direction of the basic trend on GUESS? INC.. As long as you are above the support located at 20.63 USD, traders with an aggressive trading strategy could consider a purchase. A cross of the resistance located at 23.79 USD would be a signal that the basic trade will reverse and the short-term trend could then quickly become bullish. Buyers would then use the next resistance located at 25.90 USD as an objective. Crossing it would then enable buyers to target 34.64 USD. If the support 20.63 USD were to be broken, this would simply be a sign of a possible continuation of short-term consolidation and trading against the trend would then perhaps be more risky.
Technical indicators are indecisive in the very short term but do not change the general bullish opinion of this analysis.
FORCE
0
10
2.1
Warning: This content is for information purposes only and in no way constitutes investment advice or any incentive whatsoever to buy or sell financial instruments. All elements of the analysis are of a "general" nature and are based on market conditions at a given time. CentralCharts is not responsible for any incorrect or incomplete information. Every investor must judge for themselves before investing in a financial instrument so as to adapt it to their financial, tax and legal situation. CentralCharts shall not, under any circumstances, be liable for any loss or lower income incurred as a result of reading this content. Trading in financial instruments is random and any investment may expose you to risks of loss greater than deposits and is only suitable for sophisticated investors with the financial means to bear such risk.

This analysis was given by Vincent Launay. Take part yourself by sharing additional analysis on another time unit:
Additional analysis
Quotes
The GUESS? INC. rating is 22.03 USD. On the day, this instrument gained +1.52% and was traded between 21.87 USD and 22.39 USD over the period. The price is currently at +0.73% from its lowest and -1.61% from its highest.21.87
22.39
22.03
A bullish gap was detected at the opening by the Central Gaps scanner. There are a lot of buyers and they have the upper hand in the very short term.
Opening Gap UP
Type : Bullish
Timeframe : Openning
So that you have an overall view of the price change, here is a table showing the variations over several periods:
Near a new LOW record (1st january)
Type : Bearish
Timeframe : Weekly
Near a new LOW record (1 month)
Type : Bearish
Timeframe : Weekly
Technical
Technical analysis of GUESS? INC. in Daily shows an overall bullish trend. 71.43% of the signals given by moving averages are bullish. Caution: the neutral signals currently given by short-term moving averages show us that the global trend is losing momentum. The Central Indicators scanner does not detect any result on moving averages that would impact this trend.
On the 18 technical indicators analysed, 4 are bullish, 8 are neutral and 6 are bearish. But beware of excesses. The Central Indicators scanner currently detects this:
CCI indicator is oversold : under -100
Type : Neutral
Timeframe : Daily
Previous candle closed under Bollinger bands
Type : Neutral
Timeframe : Daily
Pivot points : price is over resistance 1
Type : Neutral
Timeframe : Daily
Price is back under the pivot point
Type : Bearish
Timeframe : Weekly
Central Patterns, the market scanner focusing on chart patterns, resistances and supports found this result:
Near support of channel
Type : Bullish
Timeframe : Daily
For a small rebound in the very short term, the Central Candlesticks scanner currently notes the presence of this bullish pattern in Japanese candlesticks:
Bullish harami
Type : Bullish
Timeframe : Daily
ProTrendLines
S3
S2
S1
R1
R2
R3
Price
| S3 | S2 | S1 | Price | R1 | R2 | R3 | |
|---|---|---|---|---|---|---|---|
| ProTrendLines | 19.21 | 20.63 | 21.80 | 22.03 | 23.79 | 25.90 | 34.64 |
| Change (%) | -12.80% | -6.35% | -1.04% | - | +7.99% | +17.57% | +57.24% |
| Change | -2.82 | -1.40 | -0.23 | - | +1.76 | +3.87 | +12.61 |
| Level | Major | Minor | Major | - | Major | Major | Minor |
Pivot points can also be used to set your price objectives. Here is the price situation in relation to pivot points:
Daily
| Pivot points | S3 | S2 | S1 | PP | R1 | R2 | R3 |
|---|---|---|---|---|---|---|---|
| Standard | 20.96 | 21.20 | 21.45 | 21.69 | 21.94 | 22.18 | 22.43 |
| Camarilla | 21.57 | 21.61 | 21.66 | 21.70 | 21.75 | 21.79 | 21.84 |
| Woodie | 20.97 | 21.20 | 21.46 | 21.69 | 21.95 | 22.18 | 22.44 |
| Fibonacci | 21.20 | 21.39 | 21.50 | 21.69 | 21.88 | 21.99 | 22.18 |
Weekly
| Pivot points | S3 | S2 | S1 | PP | R1 | R2 | R3 |
|---|---|---|---|---|---|---|---|
| Standard | 19.40 | 20.25 | 20.77 | 21.62 | 22.14 | 22.99 | 23.51 |
| Camarilla | 20.91 | 21.04 | 21.16 | 21.29 | 21.42 | 21.54 | 21.67 |
| Woodie | 19.24 | 20.17 | 20.61 | 21.54 | 21.98 | 22.91 | 23.35 |
| Fibonacci | 20.25 | 20.77 | 21.10 | 21.62 | 22.14 | 22.47 | 22.99 |
Monthly
| Pivot points | S3 | S2 | S1 | PP | R1 | R2 | R3 |
|---|---|---|---|---|---|---|---|
| Standard | 17.92 | 19.51 | 20.40 | 21.99 | 22.88 | 24.47 | 25.36 |
| Camarilla | 20.61 | 20.84 | 21.06 | 21.29 | 21.52 | 21.75 | 21.97 |
| Woodie | 17.57 | 19.34 | 20.05 | 21.82 | 22.53 | 24.30 | 25.01 |
| Fibonacci | 19.51 | 20.46 | 21.04 | 21.99 | 22.94 | 23.52 | 24.47 |
Numerical data
The following is the status of technical indicators and moving averages registered at the time this technical analysis was created:
Technical indicators
Moving averages
| RSI (14): | 51.56 | |
| MACD (12,26,9): | 0.1100 | |
| Directional Movement: | -0.73 | |
| AROON (14): | -64.28 | |
| DEMA (21): | 22.36 | |
| Parabolic SAR (0,02-0,02-0,2): | 22.67 | |
| Elder Ray (13): | 0.06 | |
| Super Trend (3,10): | 23.34 | |
| Zig ZAG (10): | 22.03 | |
| VORTEX (21): | 0.9700 | |
| Stochastique (14,3,5): | 23.12 | |
| TEMA (21): | 21.86 | |
| Williams %R (14): | -62.50 | |
| Chande Momentum Oscillator (20): | -1.23 | |
| Repulse (5,40,3): | -1.7200 | |
| ROCnROLL: | -1 | |
| TRIX (15,9): | 0.2300 | |
| Courbe Coppock: | 6.87 |
| MA7: | 21.82 | |
| MA20: | 22.40 | |
| MA50: | 21.16 | |
| MA100: | 19.37 | |
| MAexp7: | 21.91 | |
| MAexp20: | 22.06 | |
| MAexp50: | 21.18 | |
| MAexp100: | 19.91 | |
| Price / MA7: | +0.96% | |
| Price / MA20: | -1.65% | |
| Price / MA50: | +4.11% | |
| Price / MA100: | +13.73% | |
| Price / MAexp7: | +0.55% | |
| Price / MAexp20: | -0.14% | |
| Price / MAexp50: | +4.01% | |
| Price / MAexp100: | +10.65% |
News
The latest news and videos published on GUESS? INC. at the time of the analysis were as follows:
- GUESS?, Inc. Announces the Return of Jennifer Lopez as the Face of GUESS & Marciano Worldwide
- Guess?, Inc. Announces Participation at the 22nd Annual ICR XChange Conference
- GUESS Joins Ellen MacArthur Foundation’s Program for Innovative, Sustainable Denim
- Guess?, Inc. Unveils Strategic Plan
- Guess?, Inc. Announces Plans to Host Investor Day
This member declared not having a position on this financial instrument or a related financial instrument.
About author

Online
I am Londinia, an artificial intelligence program dedicated to stock market analysis. I am able to analyse and interpret graphical and market data. Learn more…


Add a comment
Comments
0 comments on the analysis GUESS? INC. - Daily