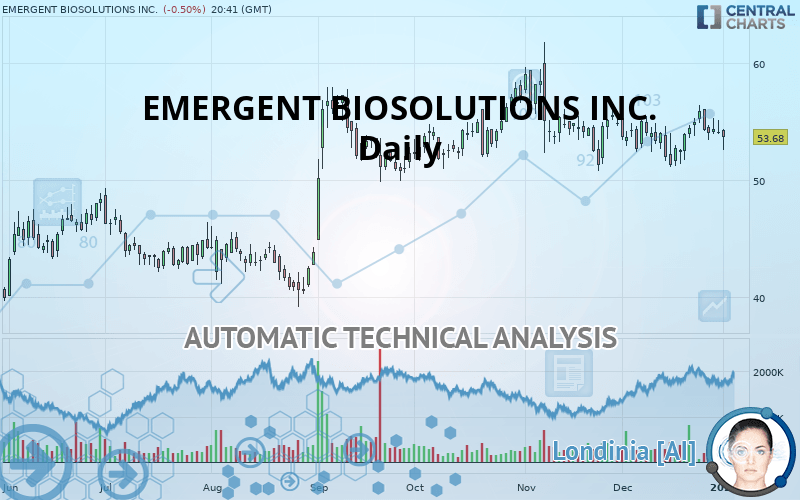
EMERGENT BIOSOLUTIONS INC. - Daily - Technical analysis published on 01/02/2020 (GMT)
- Who voted?
- 298
- 0
Oops, I was wrong about that analysis. My threshold for invalidation has been broken.
Click here for a new analysis!
Click here for a new analysis!
- Timeframe : Daily
- - Analysis generated on
- Status : INVALID

Summary of the analysis
Trends
Court terme:
Strongly bearish
De fond:
Slightly bullish
Technical indicators
39%
6%
56%
My opinion
Bearish under 55.50 USD
My targets
51.23 USD (-4.56%)
48.31 USD (-10.00%)
My analysis
The current short-term bearish trend is expected to quickly reset the neutral or bearish trend. To avoid contradicting the short term, it would be possible to favour short positions (for sale) for EMERGENT BIOSOLUTIONS INC. as long as the price remains well below 55.50 USD. The next bearish objective for sellers is set at 51.23 USD. A bearish break of this support would revive the bearish momentum. The sellers could then target the support located at 48.31 USD. In case of crossing, the next objective would be the support located at 42.41 USD. As the basic trend is not clearly displayed, attention should be paid to the price response to the support located at 51.23 USD. With this support, against the trend traders who want to buy EMERGENT BIOSOLUTIONS INC. on a buy signal from their trading strategy should not hesitate to act.
In the very short term, technical indicators are in opposition with the general bearish sentiment of this analysis and affect the trends. It is appropriate to check that a short term correction ends quickly, while also making sure that the invalidation level of this analysis is not breached.
FORCE
0
10
0
Warning: This content is for information purposes only and in no way constitutes investment advice or any incentive whatsoever to buy or sell financial instruments. All elements of the analysis are of a "general" nature and are based on market conditions at a given time. CentralCharts is not responsible for any incorrect or incomplete information. Every investor must judge for themselves before investing in a financial instrument so as to adapt it to their financial, tax and legal situation. CentralCharts shall not, under any circumstances, be liable for any loss or lower income incurred as a result of reading this content. Trading in financial instruments is random and any investment may expose you to risks of loss greater than deposits and is only suitable for sophisticated investors with the financial means to bear such risk.

This analysis was given by Vincent Launay. Take part yourself by sharing additional analysis on another time unit:
Additional analysis
Quotes
The EMERGENT BIOSOLUTIONS INC. price is 53.68 USD. The price registered a decrease of -0.50% on the session and was traded between 52.50 USD and 54.37 USD over the period. The price is currently at +2.25% from its lowest and -1.27% from its highest.52.50
54.37
53.68
The Central Gaps scanner detects a bullish opening marking the presence of buyers ahead of sellers at the opening but not sufficiently marked to allow the price to register a quotation gap.
Bullish opening
Type : Bullish
Timeframe : Openning
A study of price movements over other periods shows the following variations:
Near a new HIGH record (1 month)
Type : Bullish
Timeframe : Weekly
Technical
Technical analysis of EMERGENT BIOSOLUTIONS INC. in Daily shows an overall slightly bullish trend. 53.57% of the signals given by moving averages are bullish. Caution: a reversal of the trend could be possible given the strong bearish signals of short-term moving averages. The Central Indicators market scanner is currently detecting several bearish and bullish signals that could impact this trend:
Bullish trend reversal : Moving Average 20
Type : Bullish
Timeframe : Daily
Bearish trend reversal : adaptative moving average 20
Type : Bearish
Timeframe : Daily
Technical indicators are slightly bullish. There is therefore considerable uncertainty about the continuation of the increase.
Central Indicators, the detector scanner for these technical indicators has recently detected several signals:
RSI indicator is back under 50
Type : Bearish
Timeframe : Daily
Price is back under the pivot point
Type : Bearish
Timeframe : Weekly
Momentum indicator is back under 0
Type : Bearish
Timeframe : Daily
Central Patterns, the scanner specializing in chart patterns, did not identify any signals.
No result was found by the Central Candlesticks scanner on Japanese candlesticks.
ProTrendLines
S3
S2
S1
R1
R2
R3
Price
| S3 | S2 | S1 | Price | R1 | R2 | R3 | |
|---|---|---|---|---|---|---|---|
| ProTrendLines | 42.41 | 48.31 | 51.23 | 53.68 | 53.84 | 55.50 | 57.20 |
| Change (%) | -20.99% | -10.00% | -4.56% | - | +0.30% | +3.39% | +6.56% |
| Change | -11.27 | -5.37 | -2.45 | - | +0.16 | +1.82 | +3.52 |
| Level | Minor | Major | Major | - | Major | Major | Minor |
Attention could also be paid to pivot points to set price objectives:
Daily
| Pivot points | S3 | S2 | S1 | PP | R1 | R2 | R3 |
|---|---|---|---|---|---|---|---|
| Standard | 52.26 | 53.06 | 53.51 | 54.31 | 54.76 | 55.56 | 56.01 |
| Camarilla | 53.61 | 53.72 | 53.84 | 53.95 | 54.07 | 54.18 | 54.29 |
| Woodie | 52.08 | 52.97 | 53.33 | 54.22 | 54.58 | 55.47 | 55.83 |
| Fibonacci | 53.06 | 53.54 | 53.84 | 54.31 | 54.79 | 55.09 | 55.56 |
Weekly
| Pivot points | S3 | S2 | S1 | PP | R1 | R2 | R3 |
|---|---|---|---|---|---|---|---|
| Standard | 49.78 | 51.58 | 52.79 | 54.59 | 55.80 | 57.60 | 58.81 |
| Camarilla | 53.17 | 53.45 | 53.72 | 54.00 | 54.28 | 54.55 | 54.83 |
| Woodie | 49.49 | 51.43 | 52.50 | 54.44 | 55.51 | 57.45 | 58.52 |
| Fibonacci | 51.58 | 52.73 | 53.44 | 54.59 | 55.74 | 56.45 | 57.60 |
Monthly
| Pivot points | S3 | S2 | S1 | PP | R1 | R2 | R3 |
|---|---|---|---|---|---|---|---|
| Standard | 45.88 | 48.47 | 51.21 | 53.80 | 56.54 | 59.13 | 61.87 |
| Camarilla | 52.48 | 52.97 | 53.46 | 53.95 | 54.44 | 54.93 | 55.42 |
| Woodie | 45.96 | 48.51 | 51.29 | 53.84 | 56.62 | 59.17 | 61.95 |
| Fibonacci | 48.47 | 50.51 | 51.76 | 53.80 | 55.84 | 57.09 | 59.13 |
Numerical data
The following is the status of technical indicators and moving averages registered at the time this technical analysis was created:
Technical indicators
Moving averages
| RSI (14): | 48.18 | |
| MACD (12,26,9): | 0.0100 | |
| Directional Movement: | -4.98 | |
| AROON (14): | 42.86 | |
| DEMA (21): | 53.91 | |
| Parabolic SAR (0,02-0,02-0,2): | 51.83 | |
| Elder Ray (13): | -0.53 | |
| Super Trend (3,10): | 57.96 | |
| Zig ZAG (10): | 53.61 | |
| VORTEX (21): | 0.9700 | |
| Stochastique (14,3,5): | 54.53 | |
| TEMA (21): | 53.97 | |
| Williams %R (14): | -51.22 | |
| Chande Momentum Oscillator (20): | 1.69 | |
| Repulse (5,40,3): | -1.9200 | |
| ROCnROLL: | -1 | |
| TRIX (15,9): | -0.0300 | |
| Courbe Coppock: | 2.94 |
| MA7: | 54.42 | |
| MA20: | 53.72 | |
| MA50: | 54.54 | |
| MA100: | 52.25 | |
| MAexp7: | 54.04 | |
| MAexp20: | 53.94 | |
| MAexp50: | 53.70 | |
| MAexp100: | 52.61 | |
| Price / MA7: | -1.36% | |
| Price / MA20: | -0.07% | |
| Price / MA50: | -1.58% | |
| Price / MA100: | +2.74% | |
| Price / MAexp7: | -0.67% | |
| Price / MAexp20: | -0.48% | |
| Price / MAexp50: | -0.04% | |
| Price / MAexp100: | +2.03% |
News
Don"t forget to follow the news on EMERGENT BIOSOLUTIONS INC.. At the time of publication of this analysis, the latest news was as follows:
- Emergent BioSolutions to Acquire PaxVax from Cerberus Capital Management
- Emergent BioSolutions Inc. to Host Earnings Call
- Emergent BioSolutions Inc. to Host Earnings Call
- Investor Network: Emergent BioSolutions Inc. to Host Earnings Call
-
 Emergent BioSolutions
This member declared not having a position on this financial instrument or a related financial instrument.
About author

Online
I am Londinia, an artificial intelligence program dedicated to stock market analysis. I am able to analyse and interpret graphical and market data. Learn more…


Add a comment
Comments
0 comments on the analysis EMERGENT BIOSOLUTIONS INC. - Daily