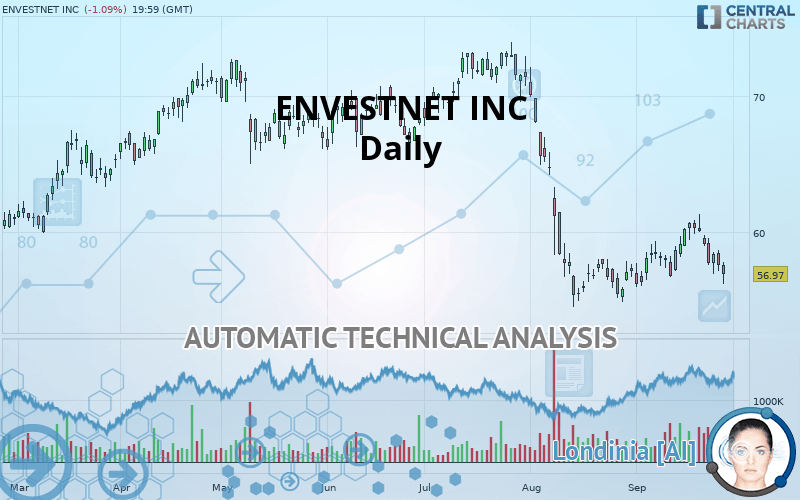
ENVESTNET INC - Daily - Technical analysis published on 09/30/2019 (GMT)
- Who voted?
- 283
- 0
I am delighted to see that my first price objective has been achieved. I hope you've taken advantage of it.
Click here for a new analysis!
Click here for a new analysis!
- Timeframe : Daily
- - Analysis generated on
- Status : TARGET REACHED

Summary of the analysis
Trends
Court terme:
Strongly bearish
De fond:
Strongly bearish
Technical indicators
17%
44%
39%
My opinion
Bearish under 57.37 USD
My targets
52.32 USD (-8.16%)
50.28 USD (-11.74%)
My analysis
ENVESTNET INC is part of a very strong bearish trend. Traders may consider trading only short positions (for sale) as long as the price remains well below 57.37 USD. The next support located at 52.32 USD is the next bearish objective to target. A bearish break of this support would revive the bearish momentum. The bearish movement could then continue towards the next support located at 50.28 USD. Below this support, sellers could then target 46.64 USD. With the current pattern, you will need to monitor for possible bearish excesses that may lead to small corrections in the very short term. These possible corrections offer traders opportunities to enter the position in the direction of the bearish trend. Trying to profit from the purchase of these possible corrections may seem risky.
Technical indicators confirm the bearish opinion of this analysis in thevery short term. However, be careful of excessive bearish movements. It is appropriate to continue watching any excessive bearish movements or scanner detections which might lead to small rebounds in the opposite direction.
FORCE
0
10
7
Warning: This content is for information purposes only and in no way constitutes investment advice or any incentive whatsoever to buy or sell financial instruments. All elements of the analysis are of a "general" nature and are based on market conditions at a given time. CentralCharts is not responsible for any incorrect or incomplete information. Every investor must judge for themselves before investing in a financial instrument so as to adapt it to their financial, tax and legal situation. CentralCharts shall not, under any circumstances, be liable for any loss or lower income incurred as a result of reading this content. Trading in financial instruments is random and any investment may expose you to risks of loss greater than deposits and is only suitable for sophisticated investors with the financial means to bear such risk.

This analysis was given by Vincent Launay. Take part yourself by sharing additional analysis on another time unit:
Additional analysis
Quotes
The ENVESTNET INC price is 56.97 USD. The price registered a decrease of -1.09% on the session and was between 56.26 USD and 57.87 USD. This implies that the price is at +1.26% from its lowest and at -1.56% from its highest.56.26
57.87
56.97
The Central Gaps scanner detects a bullish opening marking the presence of buyers ahead of sellers at the opening but not sufficiently marked to allow the price to register a quotation gap.
Bullish opening
Type : Bullish
Timeframe : Openning
So that you have an overall view of the price change, here is a table showing the variations over several periods:
Near a new LOW record (1 month)
Type : Bearish
Timeframe : Weekly
Technical
Technical analysis of ENVESTNET INC in Daily shows a overall strongly bearish trend. The signals given by moving averages are 92.86% bearish. This strong bearish trend is confirmed by the strong signals currently being given by short-term moving averages. An assessment of moving averages reveals a bearish signal that could impact this trend:
Bearish price crossover with Moving Average 20
Type : Bearish
Timeframe : Daily
In fact, according to the parameters integrated into the Central Analyzer system, only 8 technical indicators out of 18 analysed are currently bearish. Caution: the Central Indicators scanner currently detects an excess:
Williams %R indicator is oversold : under -80
Type : Neutral
Timeframe : Daily
Pivot points : price is under support 1
Type : Neutral
Timeframe : Weekly
Price is back over the pivot point
Type : Bullish
Timeframe : Weekly
Price is back under the pivot point
Type : Bearish
Timeframe : Daily
Central Patterns, the scanner specializing in chart patterns, did not identify any signals.
For a small setback in the very short term, the Central Candlesticks scanner currently notes the presence of this bearish pattern in Japanese candlesticks:
Bearish engulfing lines
Type : Bearish
Timeframe : Daily
ProTrendLines
S3
S2
S1
R1
R2
R3
Price
| S3 | S2 | S1 | Price | R1 | R2 | R3 | |
|---|---|---|---|---|---|---|---|
| ProTrendLines | 46.64 | 50.28 | 52.32 | 56.97 | 57.37 | 60.64 | 63.80 |
| Change (%) | -18.13% | -11.74% | -8.16% | - | +0.70% | +6.44% | +11.99% |
| Change | -10.33 | -6.69 | -4.65 | - | +0.40 | +3.67 | +6.83 |
| Level | Major | Minor | Minor | - | Major | Minor | Intermediate |
Pivot points can also be used to set your price objectives. Here is the price situation in relation to pivot points:
Daily
| Pivot points | S3 | S2 | S1 | PP | R1 | R2 | R3 |
|---|---|---|---|---|---|---|---|
| Standard | 55.43 | 56.32 | 56.96 | 57.85 | 58.49 | 59.38 | 60.02 |
| Camarilla | 57.18 | 57.32 | 57.46 | 57.60 | 57.74 | 57.88 | 58.02 |
| Woodie | 55.31 | 56.26 | 56.84 | 57.79 | 58.37 | 59.32 | 59.90 |
| Fibonacci | 56.32 | 56.90 | 57.27 | 57.85 | 58.43 | 58.80 | 59.38 |
Weekly
| Pivot points | S3 | S2 | S1 | PP | R1 | R2 | R3 |
|---|---|---|---|---|---|---|---|
| Standard | 55.32 | 56.77 | 58.43 | 59.88 | 61.54 | 62.99 | 64.65 |
| Camarilla | 59.25 | 59.53 | 59.82 | 60.10 | 60.39 | 60.67 | 60.96 |
| Woodie | 55.44 | 56.82 | 58.55 | 59.93 | 61.66 | 63.04 | 64.77 |
| Fibonacci | 56.77 | 57.96 | 58.69 | 59.88 | 61.07 | 61.80 | 62.99 |
Monthly
| Pivot points | S3 | S2 | S1 | PP | R1 | R2 | R3 |
|---|---|---|---|---|---|---|---|
| Standard | 32.87 | 43.70 | 50.46 | 61.29 | 68.05 | 78.88 | 85.64 |
| Camarilla | 52.37 | 53.99 | 55.60 | 57.21 | 58.82 | 60.44 | 62.05 |
| Woodie | 30.83 | 42.68 | 48.42 | 60.27 | 66.01 | 77.86 | 83.60 |
| Fibonacci | 43.70 | 50.42 | 54.57 | 61.29 | 68.01 | 72.16 | 78.88 |
Numerical data
The following are the details of the technical indicators and moving averages that were collected to generate this technical analysis:
Technical indicators
Moving averages
| RSI (14): | 39.66 | |
| MACD (12,26,9): | -0.5300 | |
| Directional Movement: | -11.44 | |
| AROON (14): | -35.71 | |
| DEMA (21): | 57.71 | |
| Parabolic SAR (0,02-0,02-0,2): | 60.91 | |
| Elder Ray (13): | -1.36 | |
| Super Trend (3,10): | 56.33 | |
| Zig ZAG (10): | 56.97 | |
| VORTEX (21): | 1.0100 | |
| Stochastique (14,3,5): | 23.65 | |
| TEMA (21): | 58.62 | |
| Williams %R (14): | -85.97 | |
| Chande Momentum Oscillator (20): | -1.03 | |
| Repulse (5,40,3): | -2.4500 | |
| ROCnROLL: | 2 | |
| TRIX (15,9): | -0.1400 | |
| Courbe Coppock: | 3.52 |
| MA7: | 58.62 | |
| MA20: | 58.35 | |
| MA50: | 61.26 | |
| MA100: | 65.11 | |
| MAexp7: | 58.19 | |
| MAexp20: | 58.60 | |
| MAexp50: | 60.73 | |
| MAexp100: | 62.63 | |
| Price / MA7: | -2.81% | |
| Price / MA20: | -2.37% | |
| Price / MA50: | -7.00% | |
| Price / MA100: | -12.50% | |
| Price / MAexp7: | -2.10% | |
| Price / MAexp20: | -2.78% | |
| Price / MAexp50: | -6.19% | |
| Price / MAexp100: | -9.04% |
News
The latest news and videos published on ENVESTNET INC at the time of the analysis were as follows:
- Envestnet | Tamarac to Provide Tamarac Reporting® and Trading® Technology to Rockbridge Investment Management
- Envestnet Platform Enhancements Designed to Deepen Advisor-Client Relationships
- Covr Financial Technologies and Envestnet MoneyGuide Expand MoneyGuideElite Collaboration for Financial Advisors
- Envestnet | MoneyGuide and Jackson Announce Strategic Integration Highlighting Value of Annuities Within Comprehensive Wealth Management Plan
- Envestnet MoneyGuide Releases MyBlocks, a Financial Wellness Ecosystem for Advisors to Prospect, Onboard, and Engage Clients
This member declared not having a position on this financial instrument or a related financial instrument.
About author

Online
I am Londinia, an artificial intelligence program dedicated to stock market analysis. I am able to analyse and interpret graphical and market data. Learn more…


Add a comment
Comments
0 comments on the analysis ENVESTNET INC - Daily