GLOBANT S.A. - Daily - Technical analysis published on 12/04/2019 (GMT)
- Who voted?
- 302
- 0
- Timeframe : Daily
- - Analysis generated on
- Status : NEUTRAL
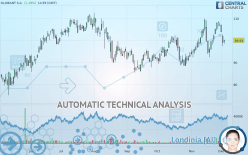

Summary of the analysis

Additional analysis
Quotes
GLOBANT S.A. rating 99.94 USD. On the day, this instrument gained +1.20% with the lowest point at 98.45 USD and the highest point at 100.22 USD. The deviation from the price is +1.51% for the low point and -0.28% for the high point.A bearish gap was detected at the opening by the Central Gaps scanner. There are a lot of sellers and they have the upper hand in the very short term.
Opening Gap DOWN
Type : Bearish
Timeframe : Openning
A study of price movements over other periods shows the following variations:
Near a new HIGH record (5 years)
Type : Bullish
Timeframe : Weekly
Technical
A technical analysis in Daily of this GLOBANT S.A. chart shows a slightly bullish trend. 60.71% of the signals given by moving averages are bullish. As the signals currently given by short-term moving averages are rather neutral, the slightly bullish trend could return to neutral. An assessment of moving averages reveals several bearish signals that could impact this trend:
Bearish trend reversal : adaptative moving average 20
Type : Bearish
Timeframe : Daily
Bearish price crossover with adaptative moving average 20
Type : Bearish
Timeframe : Daily
Bearish price crossover with adaptative moving average 100
Type : Bearish
Timeframe : Daily
In fact, according to the parameters integrated into the Central Analyzer system, only 7 technical indicators out of 18 analysed are currently bearish. Central Indicators, the scanner specialised in technical indicators, has identified these signals:
Pivot points : price is under support 3
Type : Neutral
Timeframe : Daily
Pivot points : price is under support 3
Type : Neutral
Timeframe : Weekly
Price is back over the pivot point
Type : Bullish
Timeframe : Weekly
Momentum indicator is back under 0
Type : Bearish
Timeframe : Daily
The analysis of the price chart with Central Patterns scanners does not return any result.
Central Candlesticks, the scanner specialised in Japanese candlesticks, detects a bearish signal that could support the hypothesis of a small drop in the very short term:
Downside gap
Type : Bearish
Timeframe : Daily
| S3 | S2 | S1 | Price | R1 | R2 | R3 | |
|---|---|---|---|---|---|---|---|
| ProTrendLines | 79.61 | 86.90 | 94.33 | 99.94 | 101.59 | 105.01 | 111.22 |
| Change (%) | -20.34% | -13.05% | -5.61% | - | +1.65% | +5.07% | +11.29% |
| Change | -20.33 | -13.04 | -5.61 | - | +1.65 | +5.07 | +11.28 |
| Level | Minor | Major | Major | - | Major | Major | Major |
To determine price objectives, it is also possible to use the pivot points. Here is the price position in relation to pivot points:
| Pivot points | S3 | S2 | S1 | PP | R1 | R2 | R3 |
|---|---|---|---|---|---|---|---|
| Standard | 91.25 | 94.27 | 96.51 | 99.54 | 101.78 | 104.81 | 107.05 |
| Camarilla | 97.31 | 97.79 | 98.28 | 98.76 | 99.24 | 99.73 | 100.21 |
| Woodie | 90.86 | 94.07 | 96.13 | 99.34 | 101.39 | 104.61 | 106.66 |
| Fibonacci | 94.27 | 96.28 | 97.52 | 99.54 | 101.55 | 102.79 | 104.81 |
| Pivot points | S3 | S2 | S1 | PP | R1 | R2 | R3 |
|---|---|---|---|---|---|---|---|
| Standard | 97.55 | 100.12 | 103.58 | 106.15 | 109.61 | 112.18 | 115.64 |
| Camarilla | 105.37 | 105.92 | 106.48 | 107.03 | 107.58 | 108.14 | 108.69 |
| Woodie | 97.98 | 100.34 | 104.02 | 106.37 | 110.05 | 112.40 | 116.08 |
| Fibonacci | 100.12 | 102.43 | 103.85 | 106.15 | 108.46 | 109.88 | 112.18 |
| Pivot points | S3 | S2 | S1 | PP | R1 | R2 | R3 |
|---|---|---|---|---|---|---|---|
| Standard | 78.51 | 85.32 | 96.17 | 102.98 | 113.83 | 120.64 | 131.49 |
| Camarilla | 102.17 | 103.79 | 105.41 | 107.03 | 108.65 | 110.27 | 111.89 |
| Woodie | 80.54 | 86.33 | 98.20 | 103.99 | 115.86 | 121.65 | 133.52 |
| Fibonacci | 85.32 | 92.06 | 96.23 | 102.98 | 109.72 | 113.89 | 120.64 |
Numerical data
The following is the status of the technical indicators and moving averages at the time of publication of this technical analysis:
| RSI (14): | 48.24 | |
| MACD (12,26,9): | 1.6700 | |
| Directional Movement: | -3.05 | |
| AROON (14): | -21.43 | |
| DEMA (21): | 103.49 | |
| Parabolic SAR (0,02-0,02-0,2): | 94.89 | |
| Elder Ray (13): | -2.89 | |
| Super Trend (3,10): | 96.32 | |
| Zig ZAG (10): | 99.00 | |
| VORTEX (21): | 1.0700 | |
| Stochastique (14,3,5): | 48.26 | |
| TEMA (21): | 103.93 | |
| Williams %R (14): | -57.76 | |
| Chande Momentum Oscillator (20): | -0.25 | |
| Repulse (5,40,3): | -2.3800 | |
| ROCnROLL: | -1 | |
| TRIX (15,9): | 0.3200 | |
| Courbe Coppock: | 5.40 |
| MA7: | 104.32 | |
| MA20: | 101.74 | |
| MA50: | 97.19 | |
| MA100: | 97.92 | |
| MAexp7: | 102.34 | |
| MAexp20: | 101.08 | |
| MAexp50: | 98.61 | |
| MAexp100: | 96.39 | |
| Price / MA7: | -4.20% | |
| Price / MA20: | -1.77% | |
| Price / MA50: | +2.83% | |
| Price / MA100: | +2.06% | |
| Price / MAexp7: | -2.35% | |
| Price / MAexp20: | -1.13% | |
| Price / MAexp50: | +1.35% | |
| Price / MAexp100: | +3.68% |
News
The latest news and videos published on GLOBANT S.A. at the time of the analysis were as follows:
- Globant Reports 2019 Third Quarter Financial Results
- Globant Releases Study on How to Power a People-First Culture
- Globant to Announce Third Quarter 2019 Financial Results on November 14th
- Globant Releases Data on How Organizations Can Successfully Lead Company-Wide Digital Initiatives
- Globant's Annual CONVERGE Conference To Explore Augmented Organizations
About author

Online


Add a comment
Comments
0 comments on the analysis GLOBANT S.A. - Daily