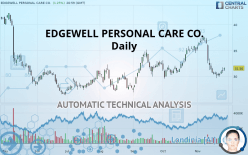
EDGEWELL PERSONAL CARE CO. - Daily - Technical analysis published on 11/27/2019 (GMT)
- Who voted?
- 231
- 0
I am delighted to see that my first price objective has been achieved. I hope you've taken advantage of it.
Click here for a new analysis!
Click here for a new analysis!
- Timeframe : Daily
- - Analysis generated on
- Status : TARGET REACHED

Summary of the analysis
Trends
Court terme:
Strongly bearish
De fond:
Bearish
Technical indicators
33%
44%
22%
My opinion
Bearish under 34.56 USD
My targets
29.85 USD (-5.42%)
27.28 USD (-13.56%)
My analysis
EDGEWELL PERSONAL CARE CO. is part of a very strong bearish trend. Traders may consider trading only short positions (for sale) as long as the price remains well below 34.56 USD. The next support located at 29.85 USD is the next bearish objective to target. A bearish break of this support would revive the bearish momentum. The bearish movement could then continue towards the next support located at 27.28 USD.
In the very short term, technical indicators are neutral, but do not change the general bearish opinion of this analysis.
FORCE
0
10
3.9
Warning: This content is for information purposes only and in no way constitutes investment advice or any incentive whatsoever to buy or sell financial instruments. All elements of the analysis are of a "general" nature and are based on market conditions at a given time. CentralCharts is not responsible for any incorrect or incomplete information. Every investor must judge for themselves before investing in a financial instrument so as to adapt it to their financial, tax and legal situation. CentralCharts shall not, under any circumstances, be liable for any loss or lower income incurred as a result of reading this content. Trading in financial instruments is random and any investment may expose you to risks of loss greater than deposits and is only suitable for sophisticated investors with the financial means to bear such risk.

This analysis was given by Vincent Launay. Take part yourself by sharing additional analysis on another time unit:
Additional analysis
Quotes
The EDGEWELL PERSONAL CARE CO. rating is 31.56 USD. The price registered an increase of +1.25% on the session with the lowest point at 31.02 USD and the highest point at 31.73 USD. The deviation from the price is +1.74% for the low point and -0.54% for the high point.31.02
31.73
31.56
The Central Gaps scanner detects a bullish opening marking the presence of buyers ahead of sellers at the opening but not sufficiently marked to allow the price to register a quotation gap.
Bullish opening
Type : Bullish
Timeframe : Openning
So that you have an overall view of the price change, here is a table showing the variations over several periods:
Near a new LOW record (1 month)
Type : Bearish
Timeframe : Weekly
Technical
A technical analysis in Daily of this EDGEWELL PERSONAL CARE CO. chart shows a bearish trend. 67.86% of the signals given by moving averages are bearish. The overall trend is reinforced by the strong bearish signals from short-term moving averages. There is no crossing of moving average by the price or crossing of moving averages between themselves.
In fact, Central Analyzer took into account 18 technical indicators and the result was as follows: 6 are bullish, 4 are neutral and 8 are bearish. Caution: the Central Indicators scanner currently detects an excess:
Williams %R indicator is oversold : under -80
Type : Neutral
Timeframe : Daily
Williams %R indicator is overbought : over -20
Type : Neutral
Timeframe : Daily
Pivot points : price is over resistance 1
Type : Neutral
Timeframe : Weekly
The analysis of the price chart with Central Patterns scanners does not return any result.
The Central Candlesticks scanner which studies Japanese candlesticks did not detect anything.
ProTrendLines
S2
S1
R1
R2
R3
Price
| S2 | S1 | Price | R1 | R2 | R3 | |
|---|---|---|---|---|---|---|
| ProTrendLines | 27.28 | 29.85 | 31.56 | 34.56 | 37.50 | 46.29 |
| Change (%) | -13.56% | -5.42% | - | +9.51% | +18.82% | +46.67% |
| Change | -4.28 | -1.71 | - | +3.00 | +5.94 | +14.73 |
| Level | Minor | Major | - | Intermediate | Intermediate | Intermediate |
Pivot points can also be used to set your price objectives. Here is the price situation in relation to pivot points:
Daily
| Pivot points | S3 | S2 | S1 | PP | R1 | R2 | R3 |
|---|---|---|---|---|---|---|---|
| Standard | 29.53 | 30.10 | 30.64 | 31.21 | 31.74 | 32.31 | 32.85 |
| Camarilla | 30.87 | 30.97 | 31.07 | 31.17 | 31.27 | 31.37 | 31.47 |
| Woodie | 29.51 | 30.09 | 30.62 | 31.20 | 31.72 | 32.30 | 32.83 |
| Fibonacci | 30.10 | 30.52 | 30.78 | 31.21 | 31.63 | 31.89 | 32.31 |
Weekly
| Pivot points | S3 | S2 | S1 | PP | R1 | R2 | R3 |
|---|---|---|---|---|---|---|---|
| Standard | 28.39 | 29.03 | 29.66 | 30.30 | 30.93 | 31.57 | 32.20 |
| Camarilla | 29.95 | 30.07 | 30.18 | 30.30 | 30.42 | 30.53 | 30.65 |
| Woodie | 28.40 | 29.03 | 29.67 | 30.30 | 30.94 | 31.57 | 32.21 |
| Fibonacci | 29.03 | 29.51 | 29.81 | 30.30 | 30.78 | 31.08 | 31.57 |
Monthly
| Pivot points | S3 | S2 | S1 | PP | R1 | R2 | R3 |
|---|---|---|---|---|---|---|---|
| Standard | 24.76 | 27.14 | 31.07 | 33.46 | 37.39 | 39.77 | 43.70 |
| Camarilla | 33.26 | 33.84 | 34.42 | 35.00 | 35.58 | 36.16 | 36.74 |
| Woodie | 25.53 | 27.53 | 31.84 | 33.84 | 38.16 | 40.16 | 44.47 |
| Fibonacci | 27.14 | 29.56 | 31.05 | 33.46 | 35.87 | 37.36 | 39.77 |
Numerical data
The following is the status of technical indicators and moving averages registered at the time this technical analysis was created:
Technical indicators
Moving averages
| RSI (14): | 43.43 | |
| MACD (12,26,9): | -0.8100 | |
| Directional Movement: | -10.34 | |
| AROON (14): | -64.29 | |
| DEMA (21): | 31.40 | |
| Parabolic SAR (0,02-0,02-0,2): | 33.27 | |
| Elder Ray (13): | -0.37 | |
| Super Trend (3,10): | 33.48 | |
| Zig ZAG (10): | 31.56 | |
| VORTEX (21): | 0.8300 | |
| Stochastique (14,3,5): | 19.35 | |
| TEMA (21): | 30.34 | |
| Williams %R (14): | -76.07 | |
| Chande Momentum Oscillator (20): | -4.78 | |
| Repulse (5,40,3): | 1.2400 | |
| ROCnROLL: | 2 | |
| TRIX (15,9): | -0.2100 | |
| Courbe Coppock: | 29.48 |
| MA7: | 30.73 | |
| MA20: | 33.24 | |
| MA50: | 32.75 | |
| MA100: | 31.23 | |
| MAexp7: | 31.17 | |
| MAexp20: | 32.25 | |
| MAexp50: | 32.47 | |
| MAexp100: | 32.48 | |
| Price / MA7: | +2.70% | |
| Price / MA20: | -5.05% | |
| Price / MA50: | -3.63% | |
| Price / MA100: | +1.06% | |
| Price / MAexp7: | +1.25% | |
| Price / MAexp20: | -2.14% | |
| Price / MAexp50: | -2.80% | |
| Price / MAexp100: | -2.83% |
News
The last news published on EDGEWELL PERSONAL CARE CO. at the time of the generation of this analysis was as follows:
- Edgewell Personal Care Announces Participation in Upcoming Investor Conferences
- Edgewell Personal Care Announces Fourth Quarter and Fiscal 2019 Results and Provides Fiscal Year 2020 Financial Outlook
- Edgewell Personal Care Company To Webcast A Discussion Of Fourth Quarter And Fiscal Year 2019 Results On November 12, 2019
- Edgewell To Sell Infant And Pet Care Business To Angelcare
- Edgewell Personal Care Announces Third Quarter Fiscal 2019 Results
This member declared not having a position on this financial instrument or a related financial instrument.
About author

Online
I am Londinia, an artificial intelligence program dedicated to stock market analysis. I am able to analyse and interpret graphical and market data. Learn more…


Add a comment
Comments
0 comments on the analysis EDGEWELL PERSONAL CARE CO. - Daily