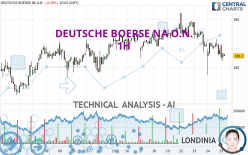
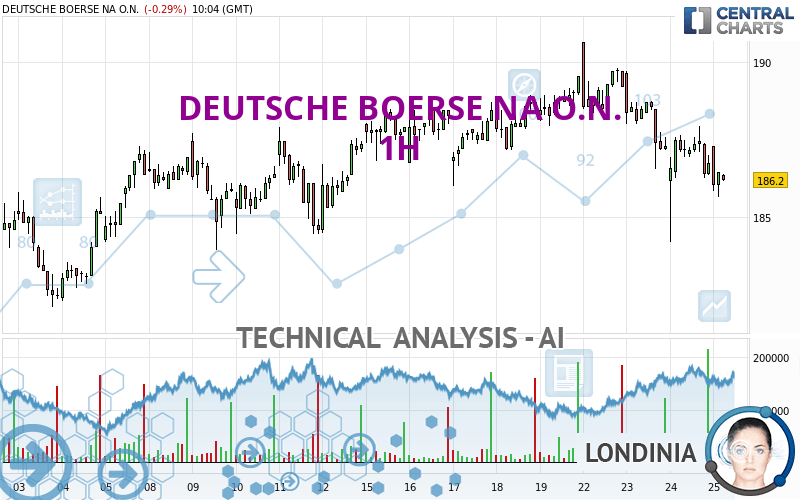
DEUTSCHE BOERSE NA O.N. - 1H - Technical analysis published on 01/25/2024 (GMT)
- 80
- 0
Click here for a new analysis!
- Timeframe : 1H
- - Analysis generated on
- Status : TARGET REACHED
Summary of the analysis

Additional analysis
Quotes
The DEUTSCHE BOERSE NA O.N. price is 186.30 EUR. On the day, this instrument lost -0.24% and was traded between 185.65 EUR and 187.30 EUR over the period. The price is currently at +0.35% from its lowest and -0.53% from its highest.A bullish opening was detected by the Central Gaps scanner. Buyers are trying to impose a bullish momentum in the very short term.
Bullish opening
Type : Bullish
Timeframe : Openning
Here is a more detailed summary of the historical variations registered by DEUTSCHE BOERSE NA O.N.:
New HIGH record (5 years)
Type : Bullish
Timeframe : Weekly
Near a new HIGH record (1 year)
Type : Bullish
Timeframe : Weekly
Near a new HIGH record (1st january)
Type : Bullish
Timeframe : Weekly
Near a new HIGH record (1 month)
Type : Bullish
Timeframe : Weekly
Technical
Technical analysis of this 1H chart of DEUTSCHE BOERSE NA O.N. indicates that the overall trend is bearish. 71.43% of the signals given by moving averages are bearish. The overall trend is reinforced by the strong bearish signals from short-term moving averages. The Central Indicators market scanner currently does not detect any result that concerns moving averages.
On the 18 technical indicators analysed, 5 are bullish, 3 are neutral and 10 are bearish. Caution: the Central Indicators scanner currently detects an excess:
CCI indicator is oversold : under -100
Type : Neutral
Timeframe : 1 hour
RSI indicator: bullish divergence
Type : Bullish
Timeframe : 1 hour
Pivot points : price is under support 1
Type : Neutral
Timeframe : Weekly
Price is back over the pivot point
Type : Bullish
Timeframe : 1 hour
Williams %R indicator is back over -50
Type : Bullish
Timeframe : 1 hour
The Central Patterns scanner, which studies chart patterns, resistances and supports, has identified this signal:
Near support of channel
Type : Bullish
Timeframe : 1 hour
The Central Candlesticks scanner which studies Japanese candlesticks did not detect anything.
| S3 | S2 | S1 | Price | R1 | R2 | R3 | |
|---|---|---|---|---|---|---|---|
| ProTrendLines | 183.96 | 185.15 | 185.97 | 186.30 | 187.91 | 189.80 | 190.65 |
| Change (%) | -1.26% | -0.62% | -0.18% | - | +0.86% | +1.88% | +2.33% |
| Change | -2.34 | -1.15 | -0.33 | - | +1.61 | +3.50 | +4.35 |
| Level | Major | Minor | Minor | - | Major | Minor | Intermediate |
To determine price objectives, it is also possible to use the pivot points. Here is the price position in relation to pivot points:
| Pivot points | S3 | S2 | S1 | PP | R1 | R2 | R3 |
|---|---|---|---|---|---|---|---|
| Standard | 180.90 | 182.55 | 184.65 | 186.30 | 188.40 | 190.05 | 192.15 |
| Camarilla | 185.72 | 186.06 | 186.41 | 186.75 | 187.09 | 187.44 | 187.78 |
| Woodie | 181.13 | 182.66 | 184.88 | 186.41 | 188.63 | 190.16 | 192.38 |
| Fibonacci | 182.55 | 183.98 | 184.87 | 186.30 | 187.73 | 188.62 | 190.05 |
| Pivot points | S3 | S2 | S1 | PP | R1 | R2 | R3 |
|---|---|---|---|---|---|---|---|
| Standard | 183.63 | 184.82 | 187.18 | 188.37 | 190.73 | 191.92 | 194.28 |
| Camarilla | 188.57 | 188.90 | 189.23 | 189.55 | 189.88 | 190.20 | 190.53 |
| Woodie | 184.23 | 185.11 | 187.78 | 188.66 | 191.33 | 192.21 | 194.88 |
| Fibonacci | 184.82 | 186.17 | 187.01 | 188.37 | 189.72 | 190.56 | 191.92 |
| Pivot points | S3 | S2 | S1 | PP | R1 | R2 | R3 |
|---|---|---|---|---|---|---|---|
| Standard | 167.17 | 171.03 | 178.77 | 182.63 | 190.37 | 194.23 | 201.97 |
| Camarilla | 183.31 | 184.37 | 185.44 | 186.50 | 187.56 | 188.63 | 189.69 |
| Woodie | 169.10 | 172.00 | 180.70 | 183.60 | 192.30 | 195.20 | 203.90 |
| Fibonacci | 171.03 | 175.47 | 178.20 | 182.63 | 187.07 | 189.80 | 194.23 |
Numerical data
The following is the status of the technical indicators and moving averages at the time of publication of this technical analysis:
| RSI (14): | 37.31 | |
| MACD (12,26,9): | -0.5300 | |
| Directional Movement: | -23.07 | |
| AROON (14): | -28.57 | |
| DEMA (21): | 186.69 | |
| Parabolic SAR (0,02-0,02-0,2): | 184.82 | |
| Elder Ray (13): | -0.99 | |
| Super Trend (3,10): | 188.44 | |
| Zig ZAG (10): | 186.45 | |
| VORTEX (21): | 0.7900 | |
| Stochastique (14,3,5): | 47.74 | |
| TEMA (21): | 186.24 | |
| Williams %R (14): | -53.49 | |
| Chande Momentum Oscillator (20): | -0.90 | |
| Repulse (5,40,3): | -0.2000 | |
| ROCnROLL: | 2 | |
| TRIX (15,9): | -0.0300 | |
| Courbe Coppock: | 1.65 |
| MA7: | 188.03 | |
| MA20: | 186.66 | |
| MA50: | 180.46 | |
| MA100: | 170.85 | |
| MAexp7: | 186.70 | |
| MAexp20: | 187.30 | |
| MAexp50: | 187.70 | |
| MAexp100: | 187.27 | |
| Price / MA7: | -0.92% | |
| Price / MA20: | -0.19% | |
| Price / MA50: | +3.24% | |
| Price / MA100: | +9.04% | |
| Price / MAexp7: | -0.21% | |
| Price / MAexp20: | -0.53% | |
| Price / MAexp50: | -0.75% | |
| Price / MAexp100: | -0.52% |
News
The latest news and videos published on DEUTSCHE BOERSE NA O.N. at the time of the analysis were as follows:
- EQS-Adhoc: Deutsche Börse AG: In the context of the 'Horizon 2026' strategy and its further refined capital management the Executive Board resolves a share buy-back program of €300 million beginning in Q1/24
- EQS-News: Deutsche Börse AG: DEUTSCHE BÖRSE ANNOUNCES THE FINAL RESULT OF THE ALL-CASH VOLUNTARY RECOMMENDED PUBLIC TAKEOVER OFFER TO THE SHAREHOLDERS OF SIMCORP A/S
- EQS-News: DEUTSCHE BÖRSE ANNOUNCES THE PRELIMINARY RESULT OF THE ALL-CASH VOLUNTARY RECOMMENDED PUBLIC TAKEOVER OFFER WITH ACCEPTANCES COMPRISING 91.11 PER CENT OF THE SHARES AND VOTING RIGHTS IN SIMCORP A/S
- EQS-News: Deutsche Börse AG: Deutsche Börse receives final regulatory approval for public takeover of SimCorp
- EQS-News: Deutsche Börse AG: PUBLICATION OF SUPPLEMENT NO. 2 TO EXTEND THE OFFER PERIOD OF THE VOLUNTARY RECOMMENDED PUBLIC TAKEOVER OFFER TO THE SHAREHOLDERS OF SIMCORP A/S UNTIL 19 SEPTEMBER 2023
About author
Online


Add a comment
Comments
0 comments on the analysis DEUTSCHE BOERSE NA O.N. - 1H