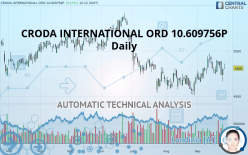
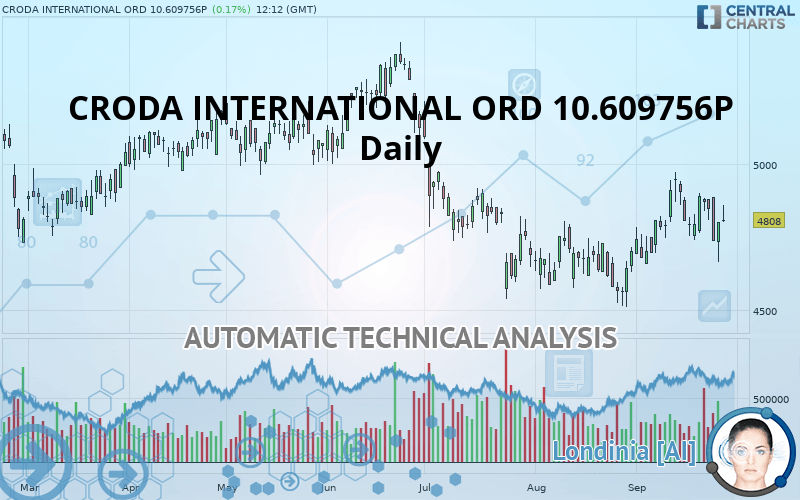
CRODA INTERNATIONAL ORD 10.609756P - Daily - Technical analysis published on 09/26/2019 (GMT)
- Who voted?
- 154
- 0
Click here for a new analysis!
- Timeframe : Daily
- - Analysis generated on
- Status : INVALID
Summary of the analysis

Additional analysis
Quotes
CRODA INTERNATIONAL ORD 10.609756P rating 4,808 GBX. The price registered an increase of +0.17% on the session and was between 4,800 GBX and 4,858 GBX. This implies that the price is at +0.17% from its lowest and at -1.03% from its highest.The Central Gaps scanner detects a bullish gap which is a sign that buyers have taken the lead in the very short term.
Opening Gap UP
Type : Bullish
Timeframe : Openning
Here is a more detailed summary of the historical variations registered by CRODA INTERNATIONAL ORD 10.609756P:
Near a new HIGH record (1 month)
Type : Bullish
Timeframe : Weekly
Technical
Technical analysis of CRODA INTERNATIONAL ORD 10.609756P in Daily shows an overall slightly bullish trend. 53.57% of the signals given by moving averages are bullish. The overall trend could accelerate as strong bullish signals from short-term moving averages are expected. An assessment of moving averages reveals several bullish signals that could impact this trend:
Moving Average bullish crossovers : AMA20 & AMA50
Type : Bullish
Timeframe : Daily
Bullish price crossover with Moving Average 20
Type : Bullish
Timeframe : Daily
Bullish price crossover with adaptative moving average 20
Type : Bullish
Timeframe : Daily
Bullish price crossover with adaptative moving average 50
Type : Bullish
Timeframe : Daily
In fact, Central Analyzer took into account 18 technical indicators and the result was as follows: 6 are bullish, 8 are neutral and 4 are bearish. But beware of excesses. The Central Indicators scanner currently detects this:
Williams %R indicator is overbought : over -20
Type : Neutral
Timeframe : Daily
RSI indicator is back over 50
Type : Bullish
Timeframe : Daily
Price is back over the pivot point
Type : Bullish
Timeframe : Daily
Momentum indicator is back over 0
Type : Bullish
Timeframe : Daily
The Central Patterns scanner, which studies chart patterns, resistances and supports, has identified this signal:
Support of channel is broken
Type : Bearish
Timeframe : Daily
The Central Candlesticks scanner, specialised in Japanese candlesticks, did not identify any signals.
| S3 | S2 | S1 | Price | R1 | R2 | R3 | |
|---|---|---|---|---|---|---|---|
| ProTrendLines | 4,467 | 4,590 | 4,781 | 4,808 | 5,028 | 5,160 | 5,318 |
| Change (%) | -7.09% | -4.53% | -0.56% | - | +4.58% | +7.32% | +10.61% |
| Change | -341 | -218 | -27 | - | +220 | +352 | +510 |
| Level | Major | Intermediate | Major | - | Intermediate | Major | Major |
Pivot points can also be used to set your price objectives. Here is the price situation in relation to pivot points:
| Pivot points | S3 | S2 | S1 | PP | R1 | R2 | R3 |
|---|---|---|---|---|---|---|---|
| Standard | 4,573 | 4,619 | 4,709 | 4,755 | 4,845 | 4,891 | 4,981 |
| Camarilla | 4,763 | 4,775 | 4,788 | 4,800 | 4,813 | 4,825 | 4,837 |
| Woodie | 4,596 | 4,630 | 4,732 | 4,766 | 4,868 | 4,902 | 5,004 |
| Fibonacci | 4,619 | 4,671 | 4,703 | 4,755 | 4,807 | 4,839 | 4,891 |
| Pivot points | S3 | S2 | S1 | PP | R1 | R2 | R3 |
|---|---|---|---|---|---|---|---|
| Standard | 4,613 | 4,675 | 4,773 | 4,835 | 4,933 | 4,995 | 5,093 |
| Camarilla | 4,826 | 4,841 | 4,855 | 4,870 | 4,885 | 4,899 | 4,914 |
| Woodie | 4,630 | 4,684 | 4,790 | 4,844 | 4,950 | 5,004 | 5,110 |
| Fibonacci | 4,675 | 4,737 | 4,774 | 4,835 | 4,897 | 4,934 | 4,995 |
| Pivot points | S3 | S2 | S1 | PP | R1 | R2 | R3 |
|---|---|---|---|---|---|---|---|
| Standard | 4,300 | 4,405 | 4,554 | 4,659 | 4,807 | 4,912 | 5,060 |
| Camarilla | 4,632 | 4,656 | 4,679 | 4,702 | 4,725 | 4,748 | 4,772 |
| Woodie | 4,322 | 4,416 | 4,575 | 4,669 | 4,829 | 4,923 | 5,082 |
| Fibonacci | 4,405 | 4,502 | 4,562 | 4,659 | 4,755 | 4,815 | 4,912 |
Numerical data
The following is the status of technical indicators and moving averages registered at the time this technical analysis was created:
| RSI (14): | 53.00 | |
| MACD (12,26,9): | 29.0000 | |
| Directional Movement: | -3 | |
| AROON (14): | -64 | |
| DEMA (21): | 4,829 | |
| Parabolic SAR (0,02-0,02-0,2): | 4,928 | |
| Elder Ray (13): | 22 | |
| Super Trend (3,10): | 4,641 | |
| Zig ZAG (10): | 4,816 | |
| VORTEX (21): | 1.0000 | |
| Stochastique (14,3,5): | 36.00 | |
| TEMA (21): | 4,856 | |
| Williams %R (14): | -51.00 | |
| Chande Momentum Oscillator (20): | 26 | |
| Repulse (5,40,3): | 0.0000 | |
| ROCnROLL: | 1 | |
| TRIX (15,9): | 0.0000 | |
| Courbe Coppock: | 3.00 |
| MA7: | 4,820 | |
| MA20: | 4,800 | |
| MA50: | 4,713 | |
| MA100: | 4,881 | |
| MAexp7: | 4,812 | |
| MAexp20: | 4,791 | |
| MAexp50: | 4,780 | |
| MAexp100: | 4,808 | |
| Price / MA7: | -0.25% | |
| Price / MA20: | +0.17% | |
| Price / MA50: | +2.02% | |
| Price / MA100: | -1.50% | |
| Price / MAexp7: | -0.08% | |
| Price / MAexp20: | +0.35% | |
| Price / MAexp50: | +0.59% | |
| Price / MAexp100: | -0% |
About author

Online


Add a comment
Comments
0 comments on the analysis CRODA INTERNATIONAL ORD 10.609756P - Daily